| vp2 (m/s) | vs2 (m/s) | |
| 46 | 1678 + 0.4% | 299 - 30.5% |
In this section we use the vertical and radial particle velocity components of the seafloor signals to invert for the near sea-bottom properties. The inversion results can be found in Table 9.
| vp2 (m/s) | vs2 (m/s) | |
| 46 | 1678 + 0.4% | 299 - 30.5% |
The values show that for both porosities, the P-wave velocity could be determined very well. The S-wave velocities, however, show very large errors.
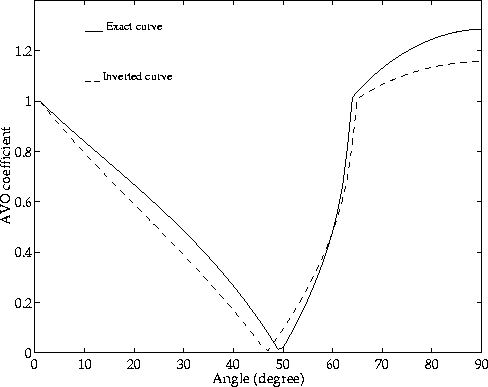
Figure 25 compares the inverted AVO curve with the theoretical one. The most significant discrepancy occurs at post-critical angles. This region is the most sensitive to changes in the S-wave velocity. The fluid appears to affect the radial particle velocity component in such a strong way that determination of the correct S-wave velocity seems to be impossible.
More work needs to be done to examine this effect of poroelasticity on the data in order to predict the near seafloor parameters. In addition to varying the porosity of the medium, it might be worthwhile to check the effect other parameter variations have.
|
vzvxp1avo
Figure 25 Inverted AVO curve versus exact one for Vz-Vr data. |  |