Next: CONCLUSIONS
Up: Mora, Clapp & Biondi:
Previous: field to plane
Using the new modules described above, and combining them with standard
AVS modules, we built an AVS network to visualize irregularly sampled data.
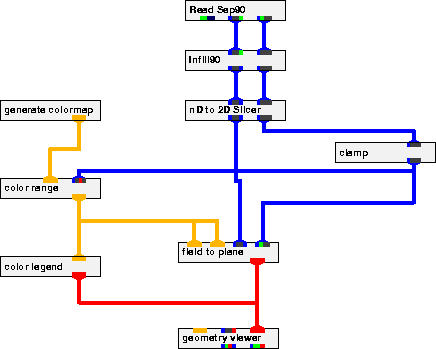
Figure 5 shows an example network. In this network, Read Sep90,
Infill90 and nD to 2D Slicer modules are connected directly
passing each output to downstream modules, reliability information from the
nD to 2D Slicer module is also directly connected to the
field to plane module
while data output is passed through the standard AVS module clamp
in order to clip the data values.
Finally, the field to plane output is passed to
AVS's geometry viewer.
net
Figure 5 AVS network to visualize irregularly sampled data.

We tested the new modules with a 3-D land survey provided by Arco.
This data set was acquired in a Button-patch geometry.
We gridded the data onto a 6-D space (time, trace_number_in_bin,
cmp_x, cmp_y, AOFFSET and azimuth). Using the Infill90 module we
stacked the data across trace_number_in_bin axis and interpolated
it across the cmp_x axis.
We took slices to display the time and AOFFSET dimensions.
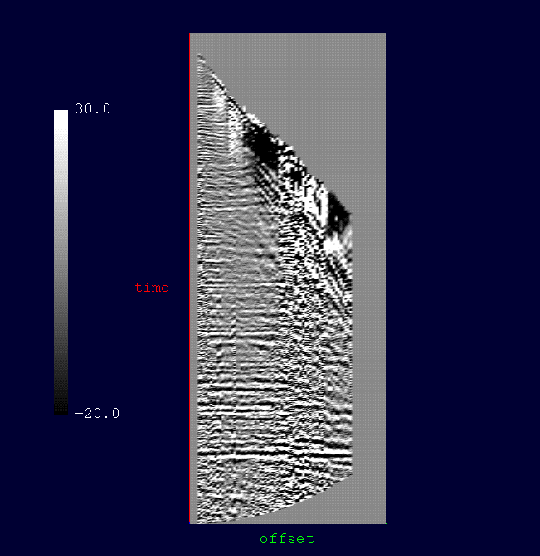
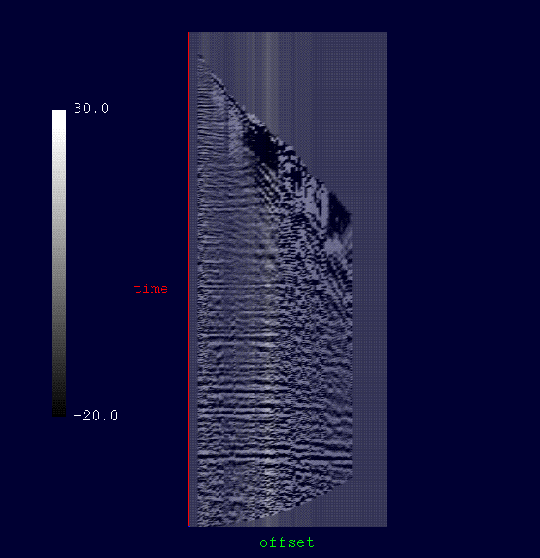
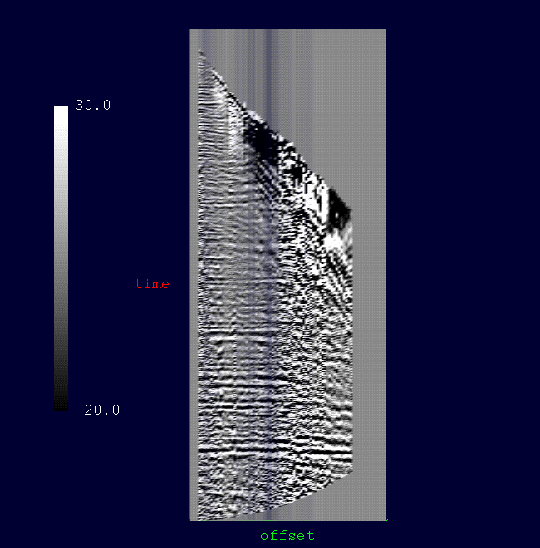
Figure 6 shows the resulting geometry displayed without
any reliability information and Figure 7 shows the same slice
with the trace transparency indicating low fold coverage. Figure 8
show the same slice with transparency indicating high fold coverage (confidence
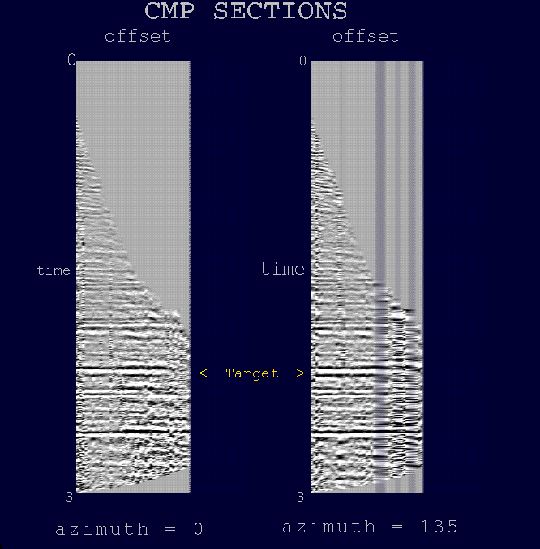
inverted). Finally, Figure 9 shows two slices corresponding to
different azimuth values. In this the case transparency indicate interpolated traces.
cmpwc
Figure 6 CMP gather display without confidence information.
cmpc
Figure 7 CMP gather. Low fold regions are more transparent. In this black and white image, transparency is not as evident, areas that
are fairly transparent appear lighter than higher fold, less transparent regions.
cmpci
Figure 8 CMP gather. High fold regions are more transparent.
cmpgather
Figure 9 CMP gathers corresponding to different azimuth values, transparency indicates interpolated traces
Next: CONCLUSIONS
Up: Mora, Clapp & Biondi:
Previous: field to plane
Stanford Exploration Project
11/11/1997