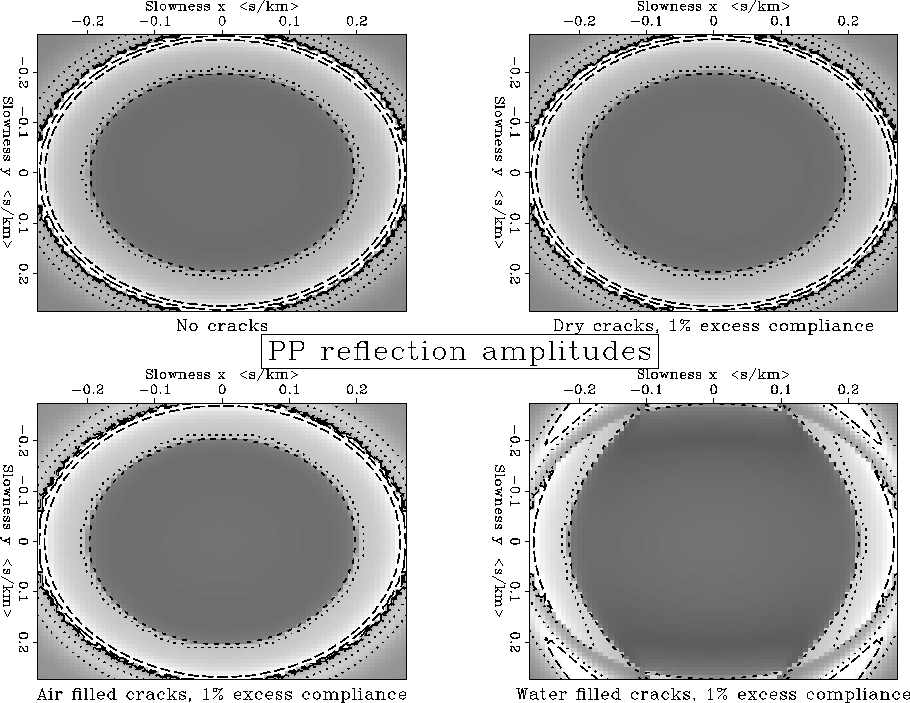
Figures 3 and 4 show the azimuthal behavior of the
reflection amplitudes as we change the fracture contents using
S&M theory. The top-left plot shows the reflection amplitudes
when the underlying chalk has not been fractured. As expected from our
isotropy experience, we can see that the contour lines show a circular
pattern (the ![]() grid on which the reflection amplitudes are
computed produces the roughness of the contour lines). We will use
this top-left plot as our comparison guide to see how the different
crack fillings (and later, for the Hudson model, the cracks' shape and
density) produce azimuthal behaviors away from the isotropic case.
The dashed lines are constant amplitude contours. The grey color scale
shows reflection amplitudes, black indicating the absence of
reflections.
grid on which the reflection amplitudes are
computed produces the roughness of the contour lines). We will use
this top-left plot as our comparison guide to see how the different
crack fillings (and later, for the Hudson model, the cracks' shape and
density) produce azimuthal behaviors away from the isotropic case.
The dashed lines are constant amplitude contours. The grey color scale
shows reflection amplitudes, black indicating the absence of
reflections.
 |
The top-right and bottom-left plots in Figure 3 model the reflection amplitudes for the case in which 1% excess compliance of dry cracks and air-filled cracks, respectively, have been added to the isotropic chalk. There are no visible changes from the ``no cracks'' plot. We use the eye as a discriminator of changes that are worth studying, that is, changes that could be detected in a surface seismic experiment.
When the cracks are filled with water (Figure 3, bottom-right plot), the changes in the reflection amplitude as a function of azimuth become evident. The impedance change between the two layers decreases along the y direction. Thus we see within the plotting window that almost all the energy is transmitted for waves propagating in the near y direction. The critical angle recedes along the y axis.
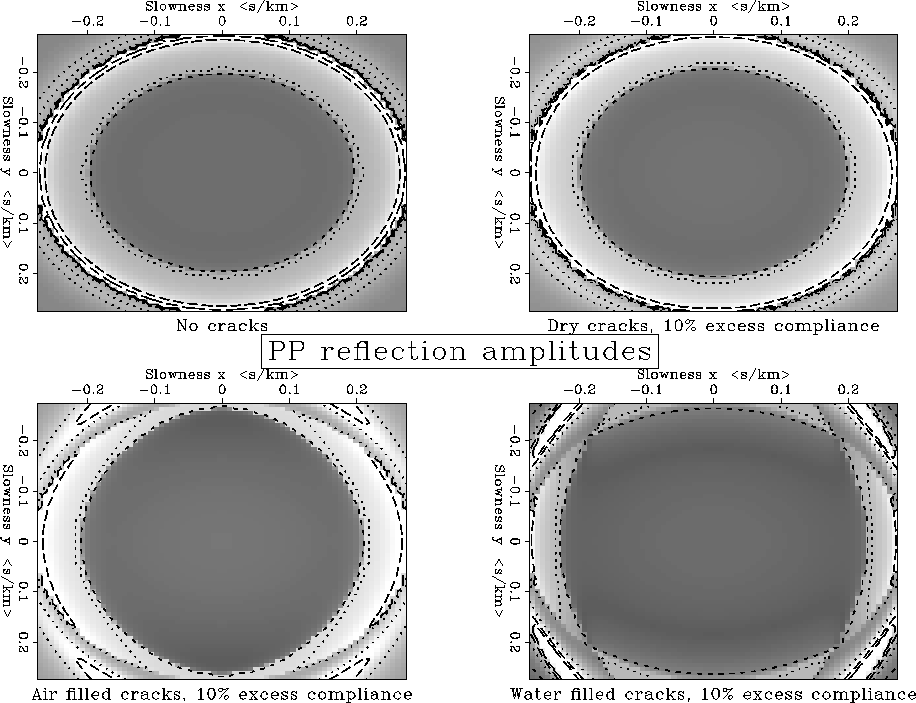
When we look Figure 4, the results look more interesting. In this figure, the experimental setup is the same as in Figure 3, but the excess compliance of the fracture crack material is changed to 10%.
 |
Once again, dry cracks have not produced any visible azimuthal variations of the reflection amplitudes. Thus in these cases an isotropic equivalent medium can give the same answer for a surface seismic experiment as the HTI medium. The air-filled cracks now produce an elliptical pattern for the inner contour line and elongate the critical angle contour line (the long dashed line that passes by and ) in the y direction.
Even more interesting is the pattern produced by the water-filled cracks. The first contour line has a double elliptic pattern (which suggests a way to obtain an approximation function for amplitude reflection). Again, the critical angle contour lines are elongated along the y direction.
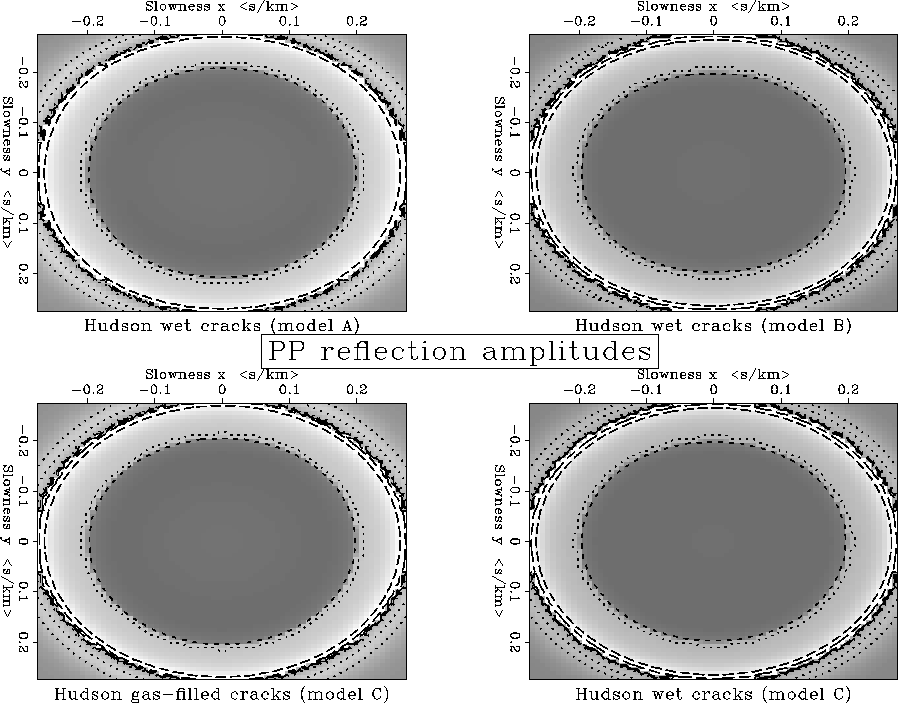
Figures 5 and 6 vary the aspect ratio and volume density of the cracks. Figure 5 was produced using a low percentage of excess compliance of the filling materials, fluid and gas. None of the plots show any distinctive azimuthal behavior. The amount of fracturing is small enough that the behavior is still isotropic for P-wave reflection amplitudes.
 |
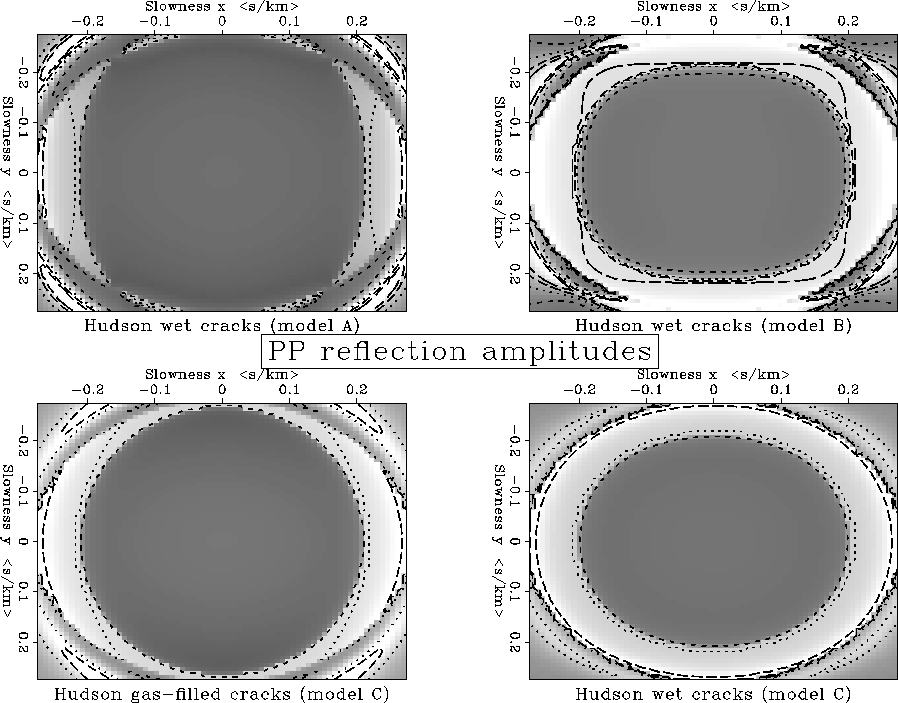
The results in Figure 6 were obtained using a percentage of excess compliance value 10 times higher than for the preceding figure. The different results show how the behaviors differ among the different fluid-filled crack models. Models A and B show distinctive double elliptic patterns for the inner contour lines. Typically, surface seismic experiments are shot only for precritical angles; thus only the inner contour lines have an effect on 3-D AVO studies. Critical angle reflections for model A recede along the y direction, while in model B we see that the critical angle reflections do not vary with azimuth.
For gas-filled cracks in model C, we obtain the same reflection amplitude patterns as for the 10% excess compliance air-filled cracks in the S&M model (Figure 4, bottom-left plot). In model C, the fluid-filled cracks behave as in an equivalent isotropic model, not displaying any azimuthal behavior.
 |