


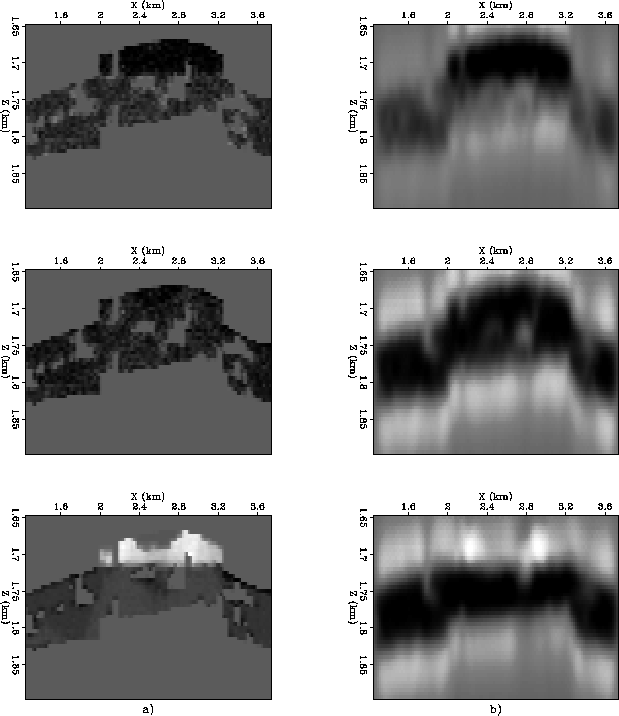
Figure 12 shows vertical sections through the acoustic impedance cube taken at cross-line 2.27 km where two water-injecting wells were located. The sections on the top show the "impedance" values at t0, while the sections in the middle show the values at t1. The bottom sections show the values at t0 subtracted from the values at t1. The effects of the water injection, which causes the gas cap to be unevenly depleted are apparent from the seismic images.
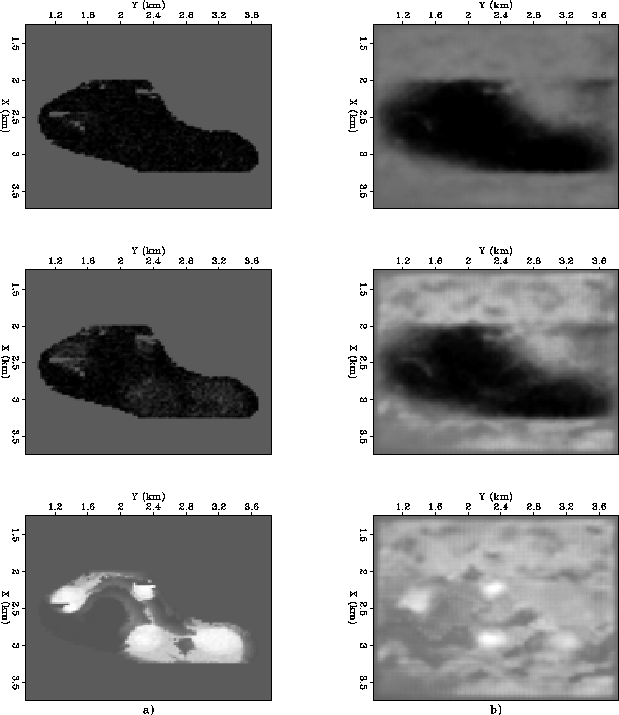
The spatially heterogeneous nature of the gas-cap depletion process is also evident from the horizontal slices shown in Figure 13, taken at a depth of 1.69 km. This images correlate very well with the images showing the gas saturation (Figure 10) and water saturation (Figure 11) in the reservoir. The relative low-frequency, and consequently low resolution, of our surveys prevents the migration to image the spatial heterogeneities at the same level of details present in the seismic impedance model. This observation confirms that reservoir monitoring does indeed require the use of advanced seismic acquisition and processing technologies aimed at maximizing the resolution of the final seismic images.
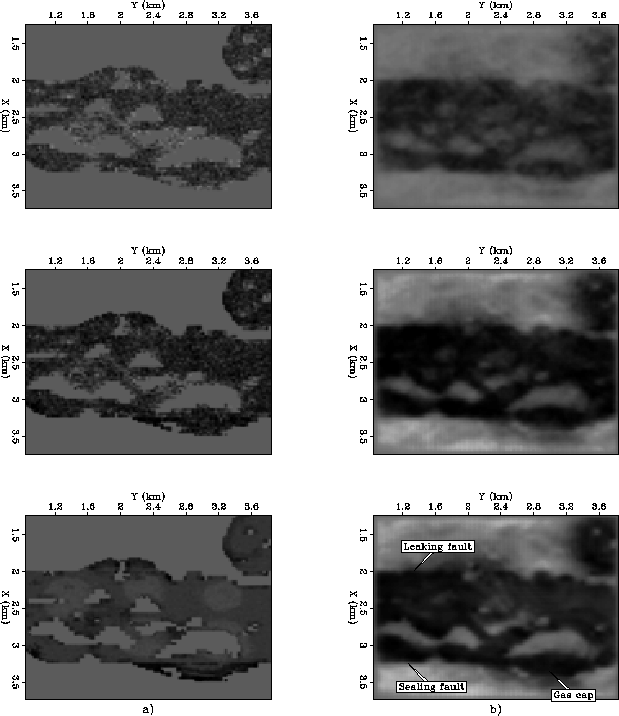
Figure 14 shows the horizontal slices taken deeper in the reservoir (1.725 km). The effects of the formation of a small gas cap on the side of the sealing fault are apparent in both difference sections. The formation of this gas cap can be also seen in the vertical slice through the gas saturation field (Figure 10a) and the vertical slice through the seismic properties (Figure 12a)). Another apparent feature of his horizontal slices are the low-permeability shale bodies, also visible in the porosity section (Figure 9b). These areas of the reservoir show very low values in the difference section, since low-permeability prevents large changes in fluid properties and are potential barriers to fluid-flow .
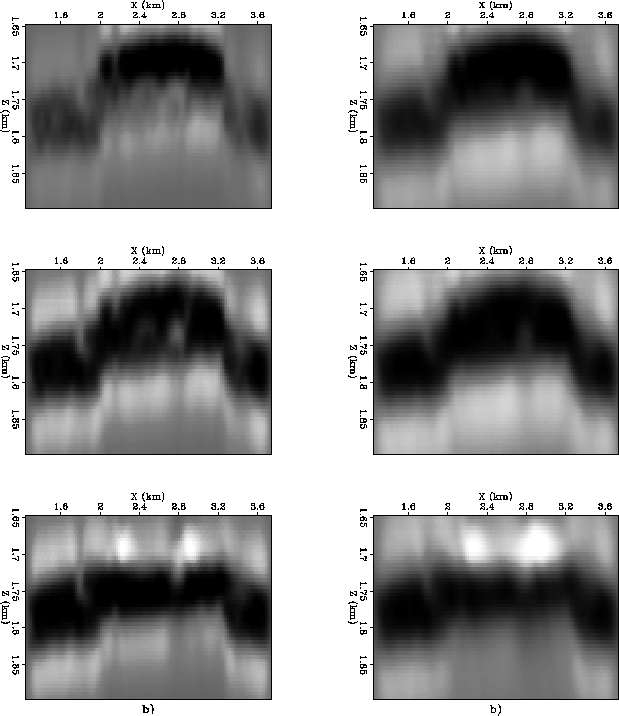
Figure 15) shows the potential additional information that can be obtained from imaging non-zero offset data. It show the same sections shown in Figure 12b, together with the equivalent section resulting from the migration of the 3 km offset data. As expected from migration theory, the results computed from non-zero offset data (Figure 15b) have lower resolution than the ones computed from zero-offset data (Figure 15a). However, beside this resolution mismatch, the variations with offset in the seismic response of gas-saturated sand is apparent from the Figure. These differences are mostly visible at t0 when the gas cap was not depleted, and in the difference section in which the effects of the water injecting wells are enhanced.
The results of the seismic imaging and modeling process suggest that fluid-flow patterns and variations of fluid properties within the reservoir can be detected using 3-D seismic surveys. However, conclusions should be drawn cautiously from these results since they were not affected by all the factors that in a real case would contribute to degrade the results of seismic imaging; such as: noise, acquisition constraints, and uncertain knowledge of the overburden parameters.
 |


 |
 |
 |