

Next: ROCK PHYSICS MODELING
Up: Geophysics-PE: Reservoir monitoring
Previous: Simulation
The Table 1 summarizes performance data for the
simulations, which were
performed on an Silicon Graphics Power Challenger with 16 processors
and 2 GB of RAM. All results used in this study were obtained using
a single processor. Some preliminary performance results for the parallel
version of Eclipse, based on PVM and a distributed
memory algorithm, are also given. The number of CPUs used is given in parenthesis.
Table 1:
Memory use and CPU-times for the fluid flow simulations.
Numbers in parenthesis indicate number of processors used.
| Models |
 |
 |
| Memory |
122 MB |
441 MB |
| Simulation time |
3 Years |
3 Years |
| V. Produced |
0.248 PV |
0.246 PV |
| CPU Time (1) |
2.2 hr |
71.0 hr |
| CPU Time (2) |
1.1 hr |
-- |
| CPU Time (4) |
0.71 hr |
-- |
| CPU Time (8) |
0.40 |
-- |
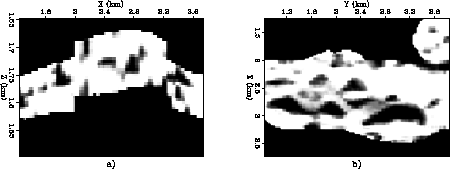
POR
Figure 9 Porosity figures: a) vertical slice at 2270 m, b) Horizontal slice at 1725 m (white high porosity)


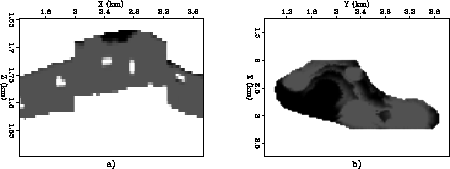
 CompSG
Figure 10 Gas saturation figures: a) vertical slice at 2270 m, b) Horizontal slice at 1690 m
showing the reduction of the gas cap through pressure maintenance by the water injectors
(white high saturation).


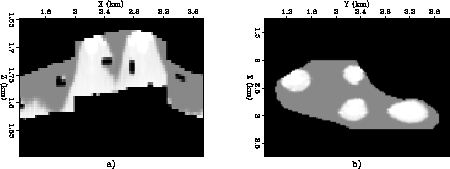
 CompSW
Figure 11 Water saturation figures: a) vertical slice at 2270 m, b) Horizontal slice at 1690 m
showing water injection under the effect of gravity and the impact of the
nonsealing and sealing faults (white high saturation)


Next: ROCK PHYSICS MODELING
Up: Geophysics-PE: Reservoir monitoring
Previous: Simulation
Stanford Exploration Project
11/12/1997


