

Next: RMO velocity analysis
Up: Measuring
Previous: Measuring
The domain for picking plays a major role
in deciding the type of tomography algorithm.
Different algorithms use different domains for picking,
such as the time or the depth in prestack or poststack, respectively.
Among these picking algorithms,
I chose the algorithm that picks events in the stacked image
after prestack migration, which requires a minimum number of
picks and provides reflector information.
The advantage of having reflector information
in the method based on event picking in the depth domain
is achieved by prestack migration.
For this research, I used planewave synthesis imaging
that synthesizes planewaves at the surface.
As an example, I have generated a synthetic data set
with finite-difference acoustic modeling.
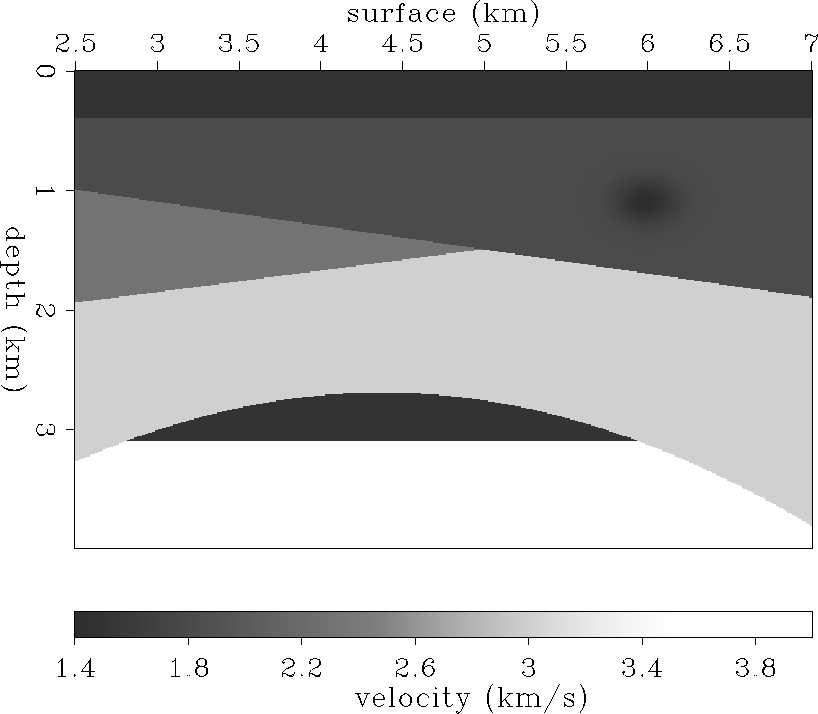
Figure ![[*]](http://sepwww.stanford.edu/latex2html/cross_ref_motif.gif) shows the interval velocity model used
to generate the synthetic data.
To avoid surface-related multiples,
an absorbing boundary is applied at the surface.
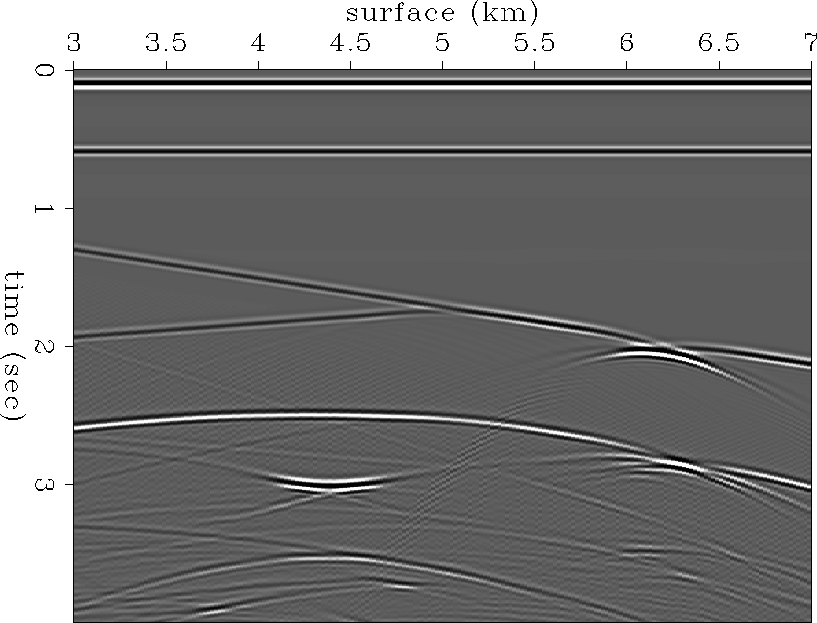
The near-offset section of the synthetic
prestack data set, Figure
shows the interval velocity model used
to generate the synthetic data.
To avoid surface-related multiples,
an absorbing boundary is applied at the surface.
The near-offset section of the synthetic
prestack data set, Figure ![[*]](http://sepwww.stanford.edu/latex2html/cross_ref_motif.gif) ,
shows that the surface-related multiples have not been generated.
,
shows that the surface-related multiples have not been generated.
As an initial guess for the velocity of the medium,
a two-layer model, shown in Figure ![[*]](http://sepwww.stanford.edu/latex2html/cross_ref_motif.gif) , is used,
with water velocity for the top layer,
because we can easily estimate the depth of the water bottom from
the seismic data even in a real case.
, is used,
with water velocity for the top layer,
because we can easily estimate the depth of the water bottom from
the seismic data even in a real case.
In order to obtain a reference image to pick dominant reflectors,
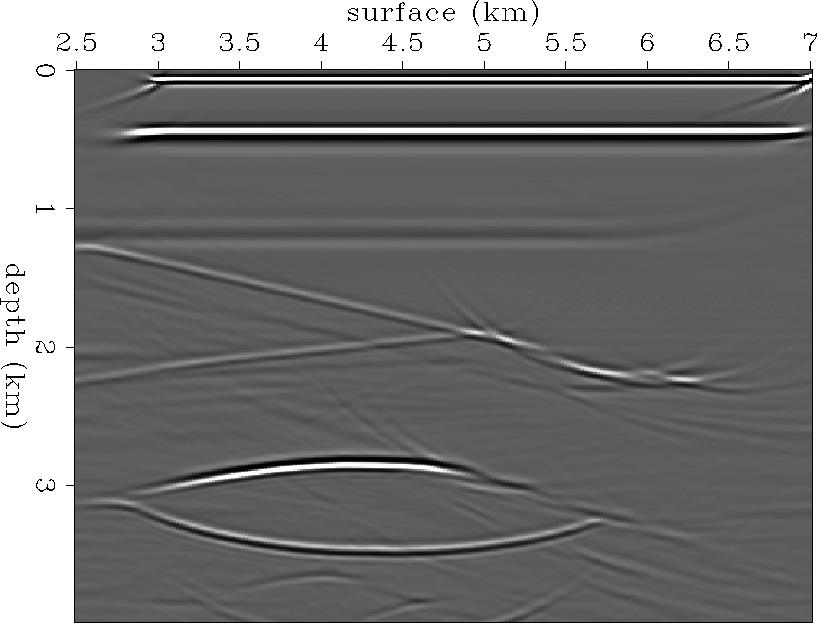
I apply surface-oriented planewave synthesis imaging.
I synthesized thirty-one different incidence angles at the surface;
the stacked image of them all is shown in Figure ![[*]](http://sepwww.stanford.edu/latex2html/cross_ref_motif.gif) .
Figure
.
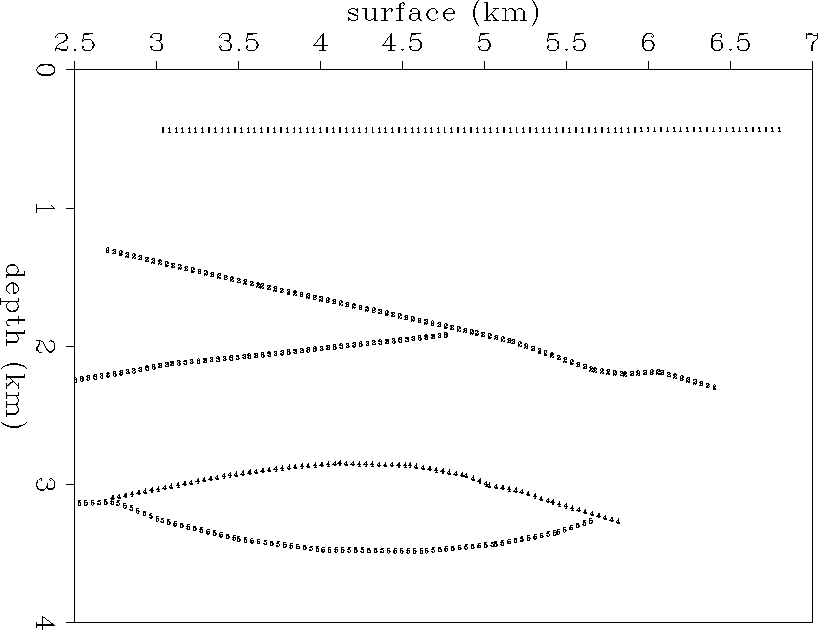
Figure ![[*]](http://sepwww.stanford.edu/latex2html/cross_ref_motif.gif) shows the locations of the reflectors picked,
with reflector numbers assigned along them.
shows the locations of the reflectors picked,
with reflector numbers assigned along them.
synvel
Figure 1 Velocity model used to generate a synthetic data set with finite-difference
acoustic modeling.


 syn-near
Figure 2 Near-offset section modeled using the finite-difference method.


 synvel-iter0
Figure 3 Velocity model used as an initial guess.
The top layer has a water velocity of 1500 m/s with the same thickness
as that of the true model, and the lower layer has a velocity of 2.5 km/s.


 pws-syn-iter0
Figure 4 Stacked image after planewave synthesis imaging that synthesized
thirty-one different incidence angles, from -30 to +30 degrees, at the surface.


 pick0
pick0
Figure 5 The picked reflectors. The numbers along each reflector represent
the reflector number assigned.


Next: RMO velocity analysis
Up: Measuring
Previous: Measuring
Stanford Exploration Project
2/5/2001
![[*]](http://sepwww.stanford.edu/latex2html/cross_ref_motif.gif) shows the interval velocity model used
to generate the synthetic data.
To avoid surface-related multiples,
an absorbing boundary is applied at the surface.
The near-offset section of the synthetic
prestack data set, Figure
shows the interval velocity model used
to generate the synthetic data.
To avoid surface-related multiples,
an absorbing boundary is applied at the surface.
The near-offset section of the synthetic
prestack data set, Figure ![[*]](http://sepwww.stanford.edu/latex2html/cross_ref_motif.gif) ,
shows that the surface-related multiples have not been generated.
,
shows that the surface-related multiples have not been generated.


