

Next: Separation by 1-D spectral
Up: Amplitude estimation of signal
Previous: Least-squares amplitude estimation
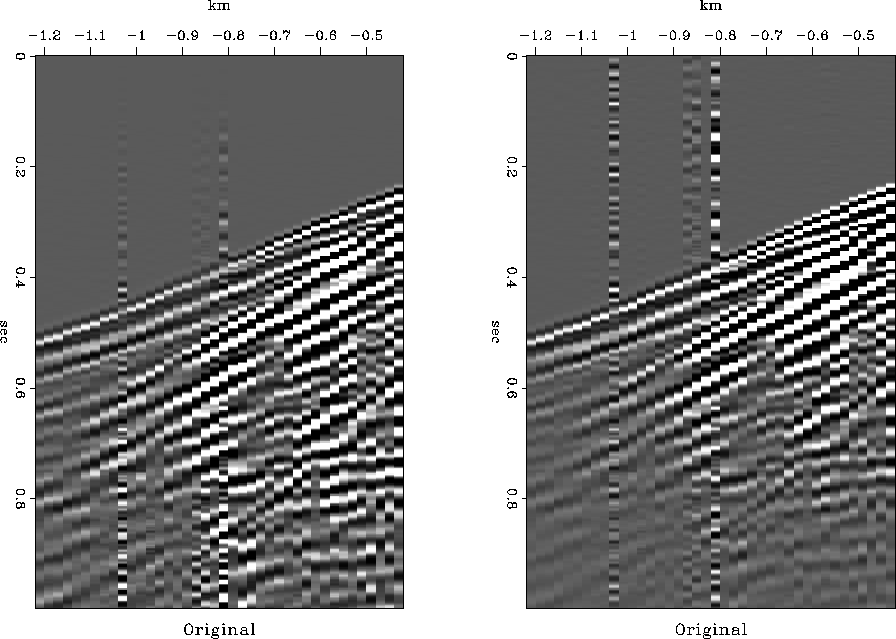
To demonstrate how the amplitude scalars appear for a real data case,
the data in Figure ![[*]](http://sepwww.stanford.edu/latex2html/cross_ref_motif.gif) were analyzed.
Figure
were analyzed.
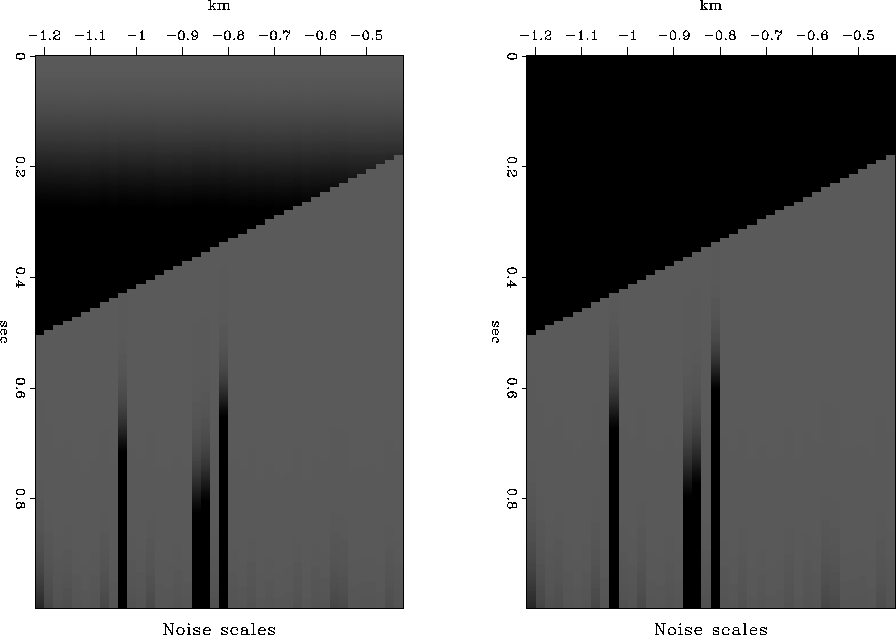
Figure ![[*]](http://sepwww.stanford.edu/latex2html/cross_ref_motif.gif) shows the calculated scale factor for the noise.
Notice that the strongest values follow what appears to be noisy
traces on the input file in Figure
shows the calculated scale factor for the noise.
Notice that the strongest values follow what appears to be noisy
traces on the input file in Figure ![[*]](http://sepwww.stanford.edu/latex2html/cross_ref_motif.gif) .
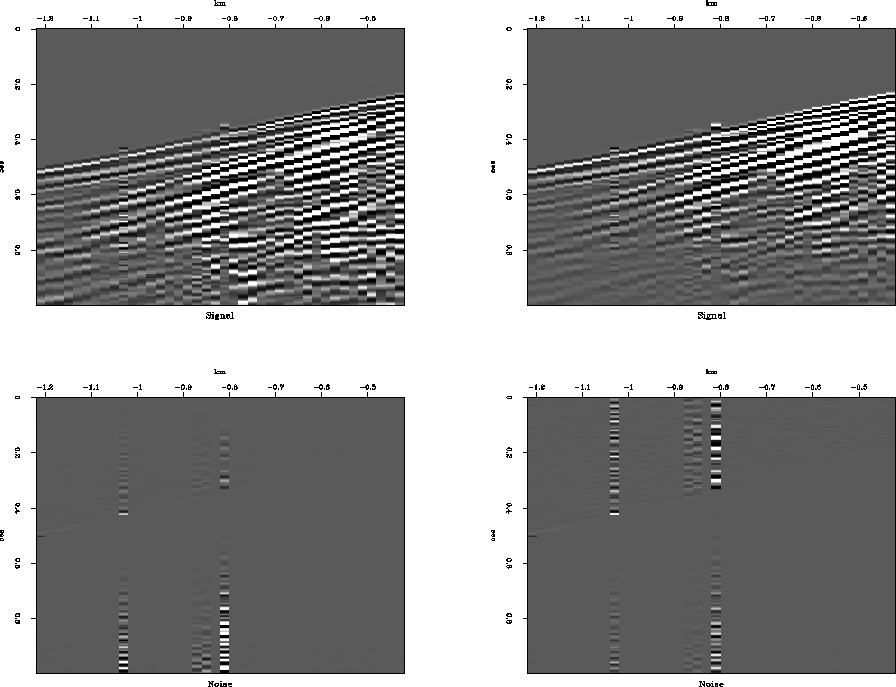
The noise in Figure
.
The noise in Figure ![[*]](http://sepwww.stanford.edu/latex2html/cross_ref_motif.gif) was scaled by the scale factor for the
noise,
which is displayed at the bottom of Figure
was scaled by the scale factor for the
noise,
which is displayed at the bottom of Figure ![[*]](http://sepwww.stanford.edu/latex2html/cross_ref_motif.gif) .
The distribution of amplitudes seems reasonable.
The top of Figure
.
The distribution of amplitudes seems reasonable.
The top of Figure ![[*]](http://sepwww.stanford.edu/latex2html/cross_ref_motif.gif) shows the original file scaled with
the calculated signal scale factors.
Once again, the distribution of amplitudes seems reasonable.
shows the original file scaled with
the calculated signal scale factors.
Once again, the distribution of amplitudes seems reasonable.
originalf
Figure 1
A shot gather with noise.
The plot on the left has t2 scaling, the plot on the right does not.


noisediag
Figure 2
The noise amplitudes based on the calculated RMS amplitudes of the signal and
noise from equation 10.18.
The plot on the left has t2 scaling, the plot on the right does not.


aamp
Figure 3
The original data scaled by the scale factors for the noise and signal.
The top row shows the data scaled by the signal scale factor.
The bottom row shows the data scaled by the noise scale factor.
The plot on the left has t2 scaling, the plot on the right does not.


Next: Separation by 1-D spectral
Up: Amplitude estimation of signal
Previous: Least-squares amplitude estimation
Stanford Exploration Project
2/9/2001
![[*]](http://sepwww.stanford.edu/latex2html/cross_ref_motif.gif) were analyzed.
Figure
were analyzed.
Figure ![[*]](http://sepwww.stanford.edu/latex2html/cross_ref_motif.gif) shows the calculated scale factor for the noise.
Notice that the strongest values follow what appears to be noisy
traces on the input file in Figure
shows the calculated scale factor for the noise.
Notice that the strongest values follow what appears to be noisy
traces on the input file in Figure ![[*]](http://sepwww.stanford.edu/latex2html/cross_ref_motif.gif) .
The noise in Figure
.
The noise in Figure ![[*]](http://sepwww.stanford.edu/latex2html/cross_ref_motif.gif) was scaled by the scale factor for the
noise,
which is displayed at the bottom of Figure
was scaled by the scale factor for the
noise,
which is displayed at the bottom of Figure ![[*]](http://sepwww.stanford.edu/latex2html/cross_ref_motif.gif) .
The distribution of amplitudes seems reasonable.
The top of Figure
.
The distribution of amplitudes seems reasonable.
The top of Figure ![[*]](http://sepwww.stanford.edu/latex2html/cross_ref_motif.gif) shows the original file scaled with
the calculated signal scale factors.
Once again, the distribution of amplitudes seems reasonable.
shows the original file scaled with
the calculated signal scale factors.
Once again, the distribution of amplitudes seems reasonable.


