


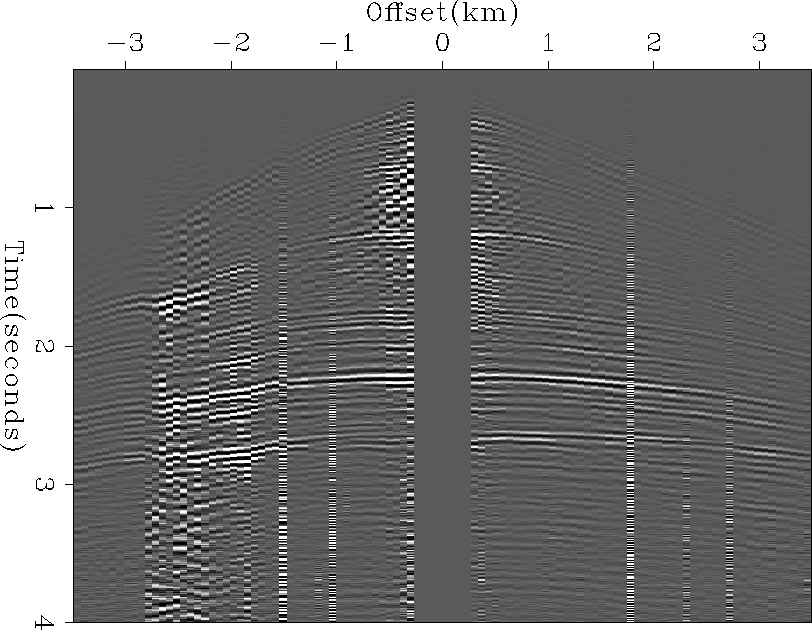
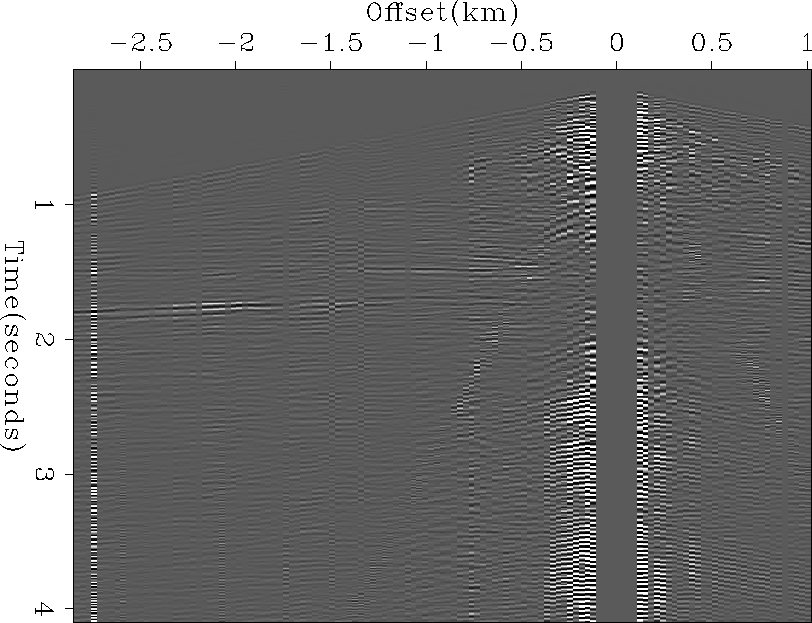
The shot gather shown in Figure ![[*]](http://sepwww.stanford.edu/latex2html/cross_ref_motif.gif) was
first processed with the high-amplitude noise removal process
shown in chapter to produce the
results in Figure .
The value of w, the multiplier of the median, was 5 in this case.
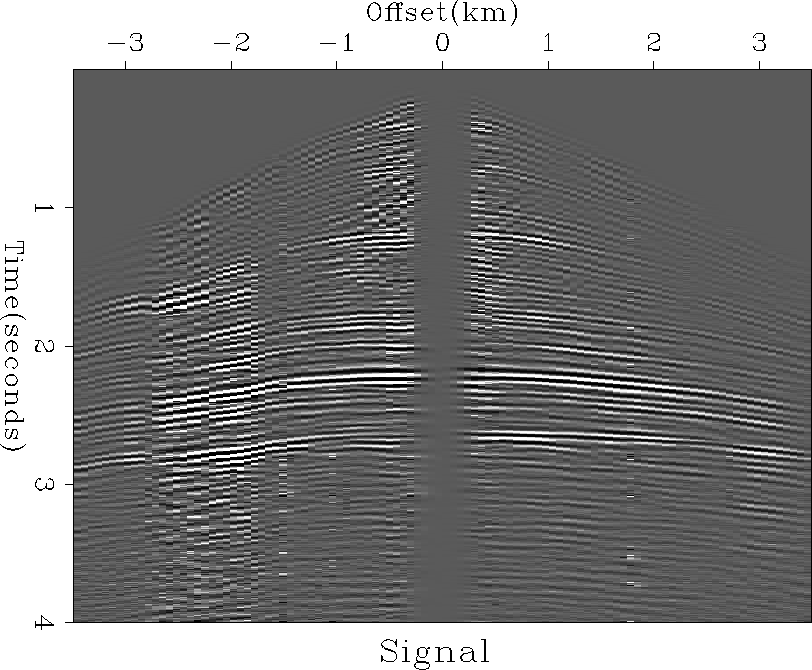
After the bad samples were removed, the inversion of system ()
was used to predict the noise and the missing data.
The missing data was then added to the known data to produce
a full set of data.
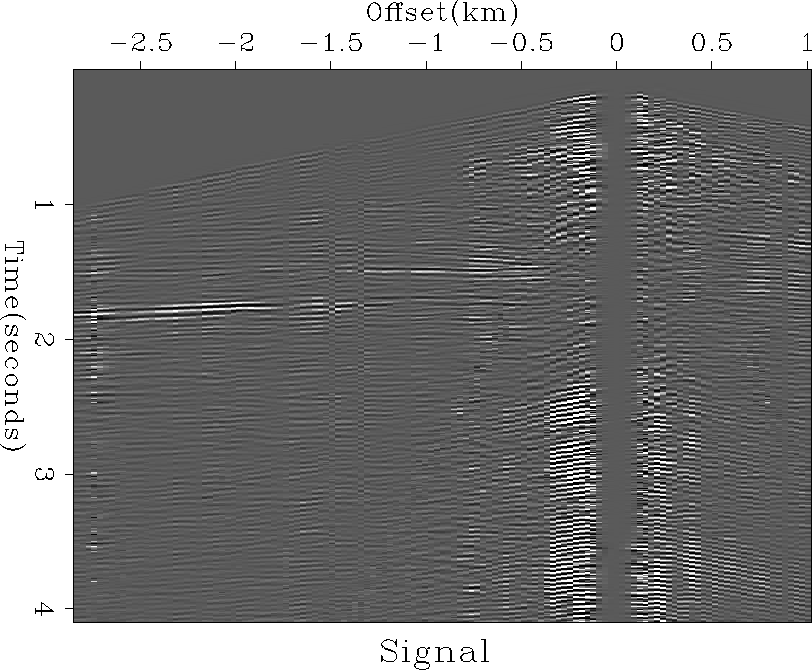
This full set of data then had the noise subtracted from it to
produce the signal section shown in Figure .
The results in Figure appear reasonable.
The noise is well attenuated and the signal appears strong.
Although the signal is not well predicted into the missing data
area near zero offset, it has been extended several traces.
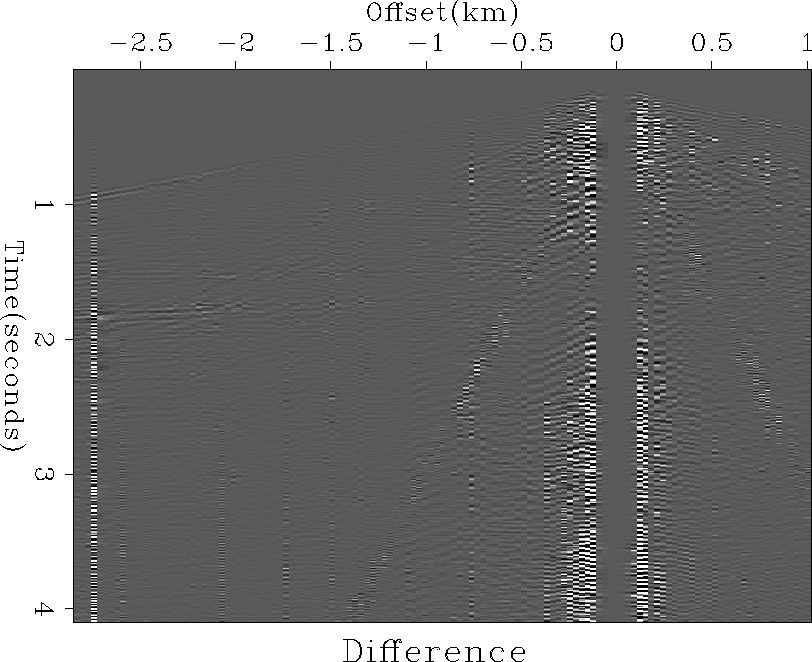
Figure shows the difference between the original
data shown in Figure and the calculated signal
shown in Figure .
While some signal appears in the difference section,
it is weak compared to the noise.
Some of this apparent signal may be due to differences in the
coupling of each receiver's geophones to the Earth.
Irregularities in the reflection amplitudes will be poorly predicted
by the signal annihilation filter and will appear in the noise section.
was
first processed with the high-amplitude noise removal process
shown in chapter to produce the
results in Figure .
The value of w, the multiplier of the median, was 5 in this case.
After the bad samples were removed, the inversion of system ()
was used to predict the noise and the missing data.
The missing data was then added to the known data to produce
a full set of data.
This full set of data then had the noise subtracted from it to
produce the signal section shown in Figure .
The results in Figure appear reasonable.
The noise is well attenuated and the signal appears strong.
Although the signal is not well predicted into the missing data
area near zero offset, it has been extended several traces.
Figure shows the difference between the original
data shown in Figure and the calculated signal
shown in Figure .
While some signal appears in the difference section,
it is weak compared to the noise.
Some of this apparent signal may be due to differences in the
coupling of each receiver's geophones to the Earth.
Irregularities in the reflection amplitudes will be poorly predicted
by the signal annihilation filter and will appear in the noise section.
 |


 |
 |
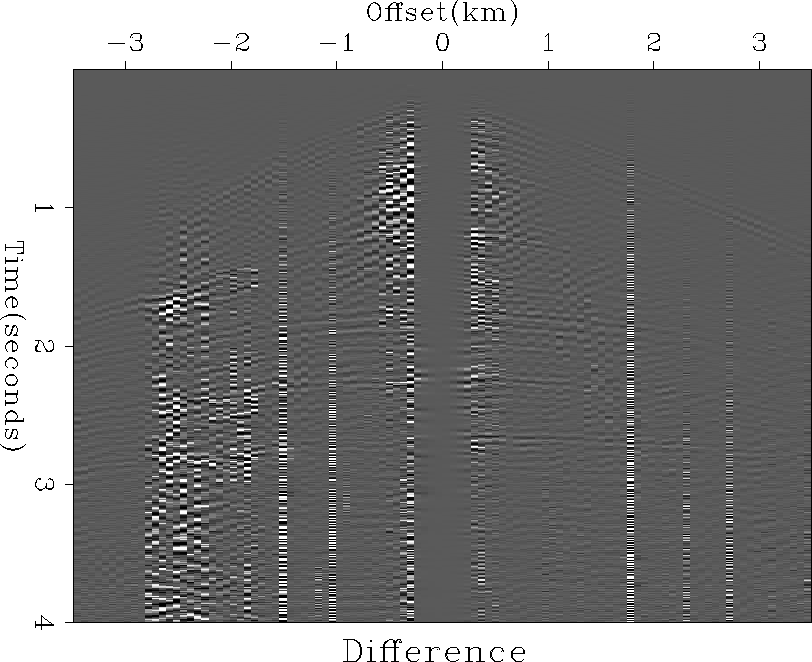 |
Figure shows the data from Figure
with the noise removal applied.
Next, Figure shows the data from Figure
where the inversion was used to predict the
missing data while separating signal and noise, as in the previous Figures.
Notice that most of
the coherent noise discussed previously was not restored into
the signal in Figure .
Figure shows the difference between the original data and
the noise. Little signal has leaked into the noise section and
the results appear satisfactory.
 |
 |
 |
 |