

Next: Downward continuation
Up: ESTIMATION OF NEAR SURFACE
Previous: ESTIMATION OF NEAR SURFACE
Because the dip of the ``X'' patterns in
Figure 4 can be interpreted as a
measure of depth, it is possible to image near surface velocity
perturbations by performing slant stacks of the power plots. I use a
slightly modified version of the conjugate gradient slant stack
inversion code written by
Claerbout 1993 to locate the anomalies.
The input to the algorithm is the logarithm of the power plots shown in
Figure 4. Ten steps of conjugate gradient are used to minimize

where S is the inverse slant stack operator,
d is the input power map, and m is the unknown velocity structure.
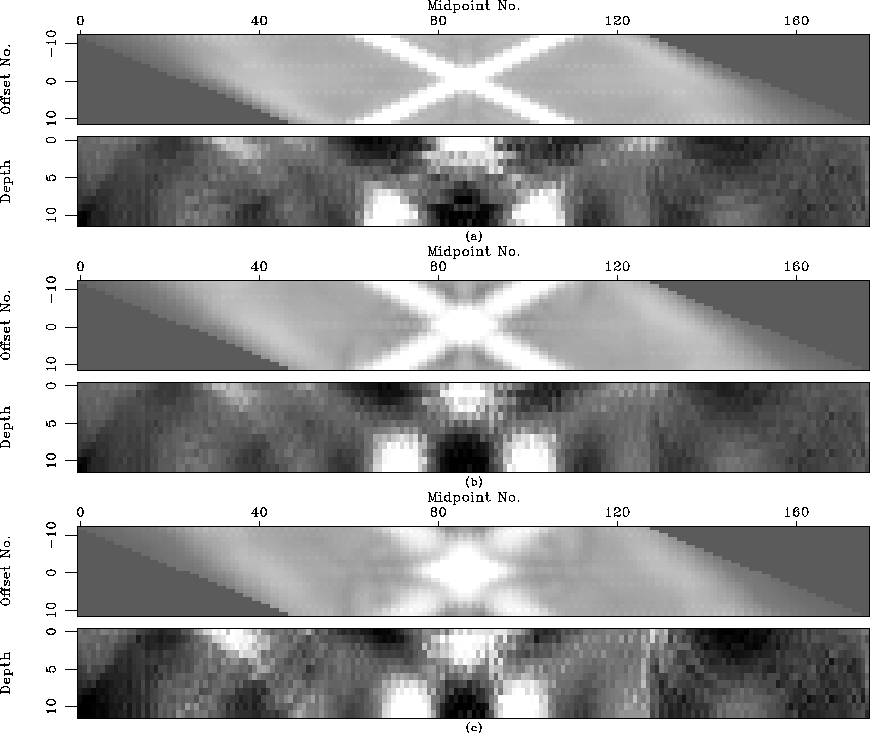
The results of the slant stack inversion are presented along with the
power plots in Figure 5.
In all cases the image of the anomaly occurs directly below the center
of the ``X''. The images exhibit artifacts at the bottom of the plot which
are probably due to data truncation.
The reconstructed image shows the anomaly to be just below the surface.
It is clear that as the depth of the anomaly increases, the
image moves deeper.
tomoall
Figure 5 The trace power maps and depth images are displayed for
velocity perturbations at three different depths.
(a) The top two plots are for a velocity perturbation at shallow depth,
(b) the middle two are for a velocity perturbation at intermediate depth,
and (c) the bottom two are for a velocity perturbation at greater depth.
The image of the velocity perturbation is the blob of energy directly below
the surface in the center of the plots. As the anomaly gets deeper
the legs of the ``X'' get closer together and the images move further
away from the surface.


Although the slant stack reconstruction qualitatively images the anomaly,
more work is required to refine the algorithm, eliminate artifacts and
increase resolution. The relationship between the pseudo-depth of the images
and the actual depth has also not yet been worked out. Resolution is
limited by the small input data set and by unresolved imperfections in the
imaging algorithm.


Next: Downward continuation
Up: ESTIMATION OF NEAR SURFACE
Previous: ESTIMATION OF NEAR SURFACE
Stanford Exploration Project
11/16/1997
![]()
