 |
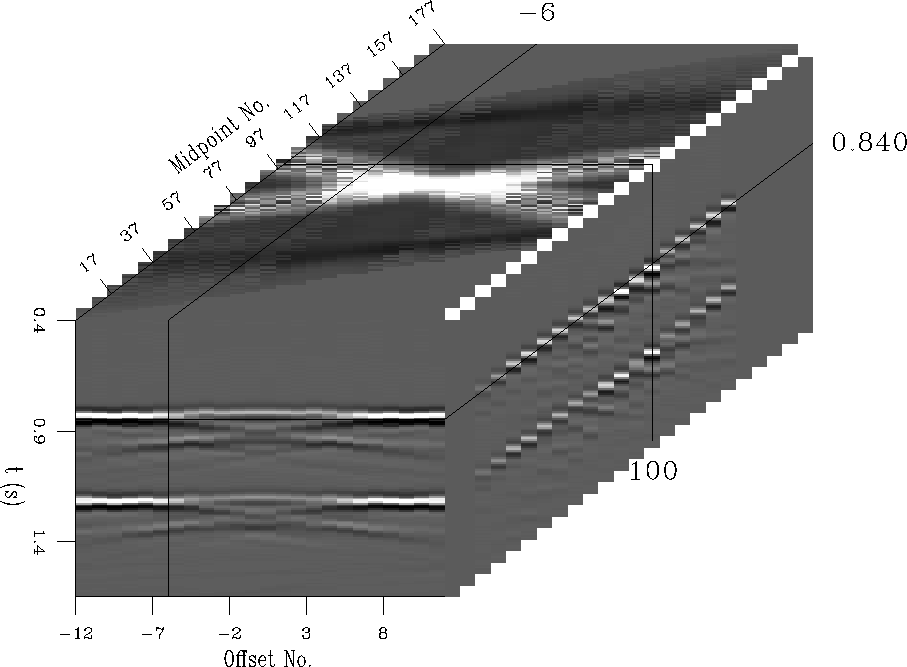
Figure 3 Synthetic CMP data after NMO correction. The velocity perturbation causes the distinctive ``X'' pattern visible in the time slice.
The synthetic data are sorted into common midpoint gathers and NMO corrected. The resulting data cube is displayed in Figure 3. The effect of the velocity anomaly is seen as a symmetric ``X'' pattern visible in the top panel of the data cube. This top panel is a time slice through one of the reflection events.
 |
Kjartansson 1979 made plots of trace power in
midpoint-offset coordinates and observed ``V'' shaped patterns due to
shallow velocity or absorption anomalies in the Grand Isle data set (see
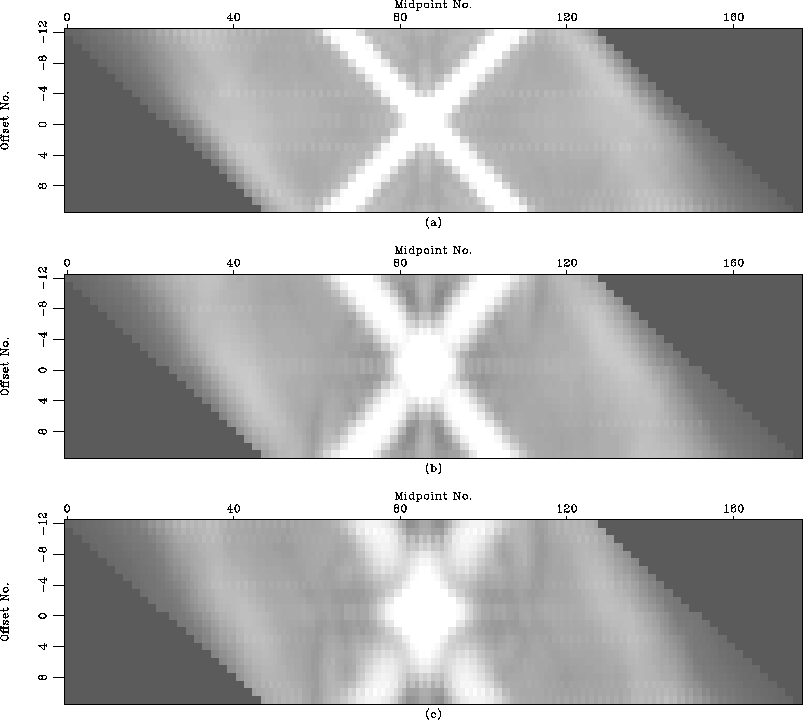
also Claerbout 1993). In Figure 4,
I have plotted
trace power for three different synthetic data sets with velocity anomalies
centered at depths of ![]() ,
, ![]() and
and ![]() .
The trace power is calculated by taking the square root of the sum of
the squares of the trace amplitudes. The ``X'' patterns
arise because the synthetics are split spread to simulate land data
acquisition.
For deeper anomalies the legs of the ``X'' are closer to the midpoint
axis. For shallower anomalies the legs of the ``X'' are closer to the
.
The trace power is calculated by taking the square root of the sum of
the squares of the trace amplitudes. The ``X'' patterns
arise because the synthetics are split spread to simulate land data
acquisition.
For deeper anomalies the legs of the ``X'' are closer to the midpoint
axis. For shallower anomalies the legs of the ``X'' are closer to the
![]() lines representing the shot and group axes.
lines representing the shot and group axes.
The qualitative observation that the trajectory of the ``X'' patterns is a function of anomaly depth gives rise to the slant stack imaging method of the next section.
 |