 |
(3) |
Gardner 1990 introduced the DMO-NMO method and derived a DMO amplitude factor that is directly related to the curvature of the operator through the expression
 |
(4) |
 |
(5) |
|
Amp
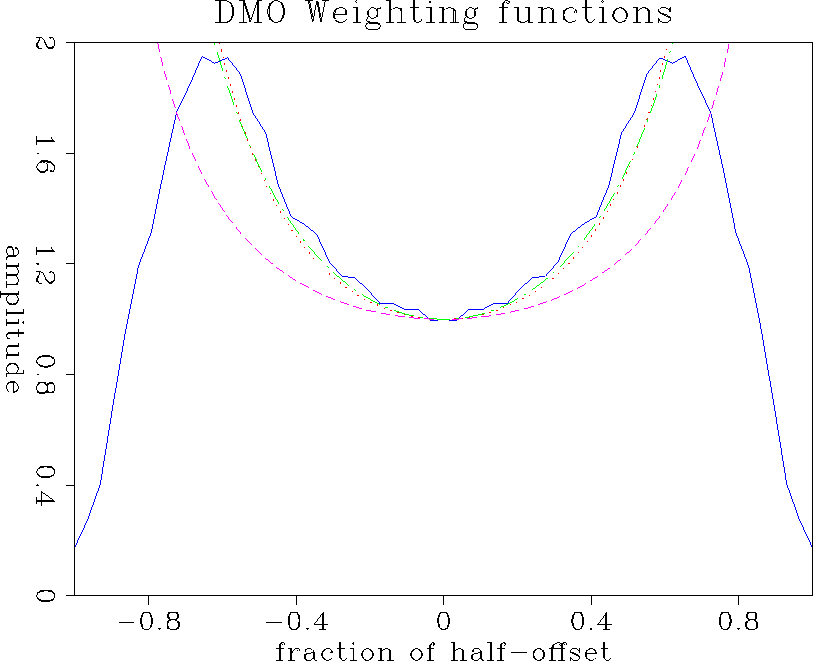
Figure 3 Normalized weighting schemes compared to (f,k) DMO amplitudes. Dotted line: Beasley; Dashed line: Gardner; Dashed-dotted line: Black; Solid line: picked amplitudes on the (f,k) DMO operator. |  |
I now apply the rules to the three weighting schemes and compare their results.
Rule 1. Figure (3) shows the comparison of the different weighting schemes normalized by their value at x=0 with the amplitude picked along the impulse response of an (f,k) DMO program (Zhang's formulation). The different curves agree in shape, their concavity turned upward. However, Black's and Beasley's schemes are closer to the (f,k) DMO amplitudes. The decrease in amplitude of the (f,k) amplitude when x increases is caused by the velocity-dependent dip limitation of the operator. The three weighting functions have been plotted up to x=h without taking the limitation into account.
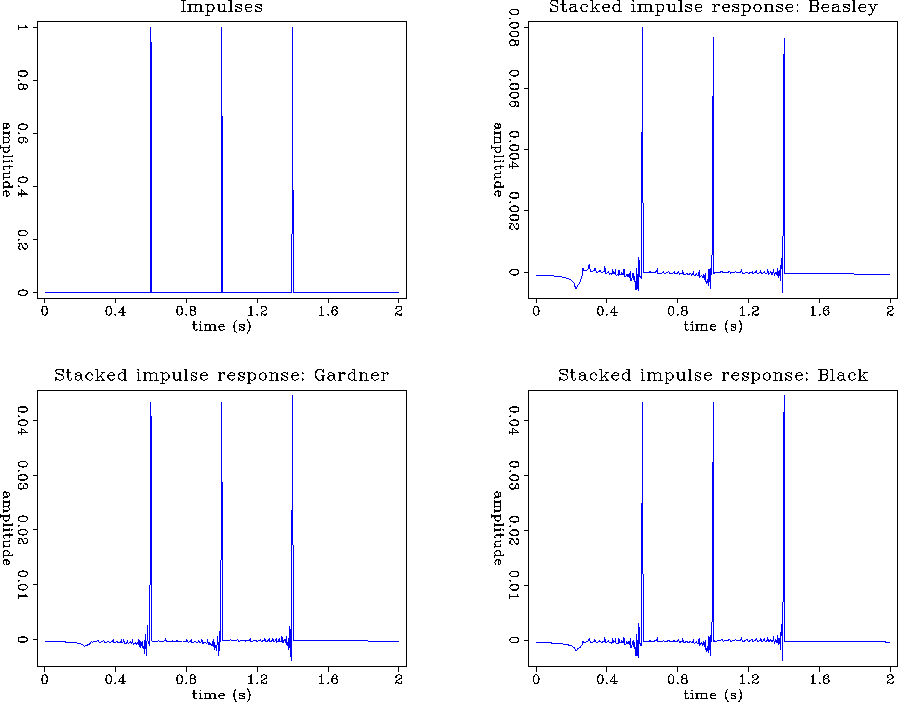
Rule 2. Figure (4) shows impulse responses that have been stacked along the x-axis. This stack simulates the contribution of impulse responses along a horizontal planar reflector to a single trace. Thus, to obey the second rule, the stacked impulse response should yield the input impulse. The three weighting schemes restore the balanced amplitudes of the impulse rather well. However, Gardner's and Black's schemes show a better stack, especially at earlier times, where Beasley's weighting produces strongest artifacts.
 |
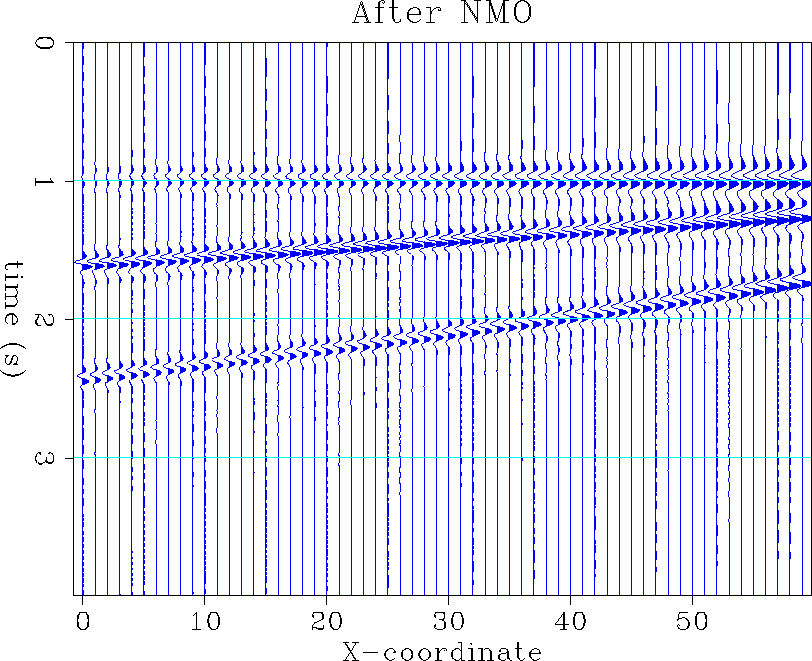
Rule 3. In order to verify the third rule, I used a 3-D synthetic dataset created by David Lumley. Figure (5) shows an NMO-corrected section of the model for a shot located at x = 0. The structure is composed of three planar reflectors: a horizontal reflector showing some AVO effect (the amplitudes increase away from the source) and two shallow, dipping reflectors (15 and 30 degrees).
|
Nmo
Figure 5 A slice in the 3-D data after NMO. The horizontal plane shows some AVO effect. The two other planes dip at a 15-degree and a 30-degree angle, respectively. |  |
Figure (6) shows the result on the same section after the 3-D DMO. Some strong artifacts appear above the horizontal reflector, and the amplitudes are not well balanced along the reflectors or in relation to each other. This poor result is mainly caused by omission of spherical spreading and the amplitude-boosting effect of the anti-aliasing triangles.
|
Dmo1
Figure 6 A slice in the 3-D data after DMO with Black's amplitudes, without spherical spreading and without triangle effect corrections. |  |