Assuming further isotropic layers (this is not necessary, if we have more information) the P and S wave sonic log together with the density log specify an isotropic stiffness matrix. For each well log point in depth, these measurements are transformed into the group domain (§+M, 1990). The important point is that all the smoothing is carried out in the group domain.
| |
(1) |
It is not readily clear what the best smoothing operator is. I chose to use a boxcar smoothing operator. After smoothing the data in the group domain, the resulting effective medium will in general not be isotropic, but instead transversely isotropic. A useful elliptic approximation, as derived by Muir (1991), introduces in this way an effective NMO velocity.
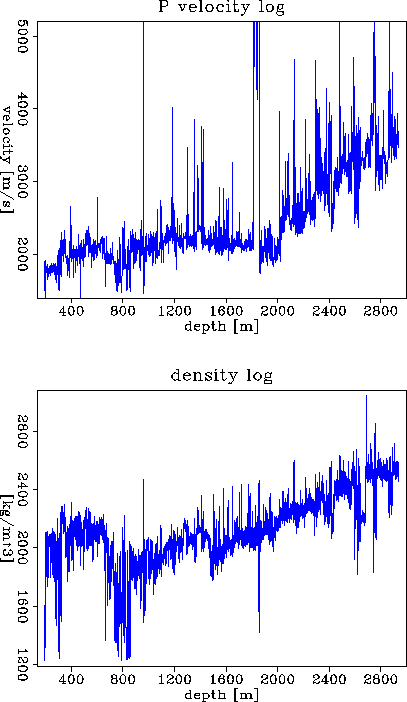 |
Figure 5 shows the ingredients for generating the isotropic stiffness log. From this stiffness log the §+M group transformation is applied resulting in a group log. Using this group log an equivalent medium can be calculated by partially integrating all the layers up to a certain depth point in the log, given by
| (2) |
This integration replaces the overburden at a specific depth point by a homogeneous equivalent medium. At the same time it preserves all stress and stain components across layer boundaries, honoring solid-solid boundary conditions exactly. For liquid layers different group elements have to be chosen, but the usage is identical. The elastic energy is conserved in this averaging process. See Nichols and Karrenbach 1990 for more details.
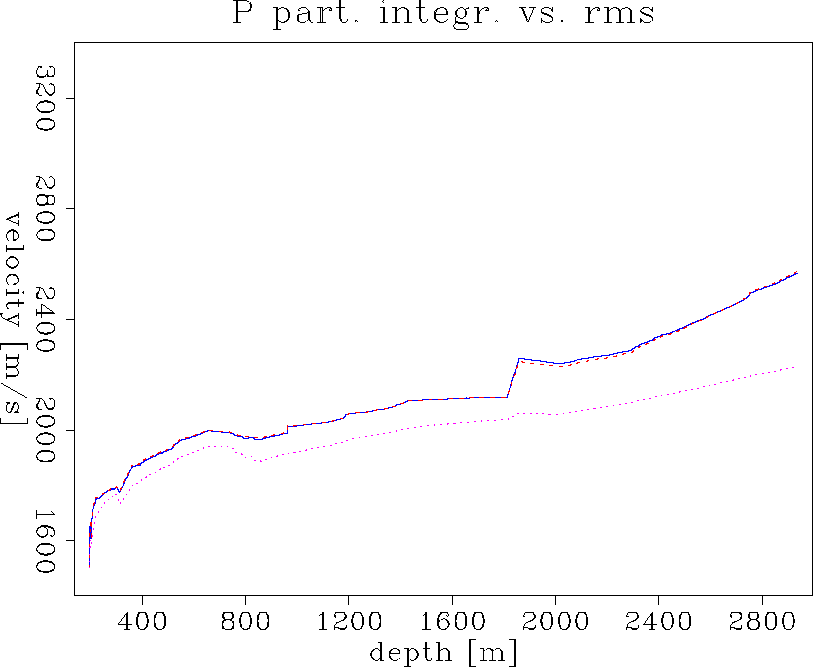 |
Figure 6 shows the well log derived Dix rms velocity and the horizontal and vertical velocities calculated using the §+M partial integration. The Dix rms velocity is the solid curve, which is nearly identical with the horizontal §+M velocity vx. The vertical propagation velocity vz is clearly distinct from these other two curves. It is not surprising that this partially integrated medium is no longer isotropic. It is a well known fact Backus (1962) that a sequence of thin layers produces anisotropic propagation effects for wavelengths much longer than the layering scale. Based on the assumption that the original material was thinly layered isotropic, the partially integrated medium is now transverse isotropic. I am only comparing P velocities since, I started out with only a P sonic log and I had to assume a shear wave velocity. In Figure 6 I extracted only direct wave velocities, but using a paraxial approximation (Dellinger et al. (1993)) it is possible to extract ``NMO'' velocities. For relating elastic properties to moveout velocities see the paraxial approximation around the vertical axis for TI media in the Appendix.
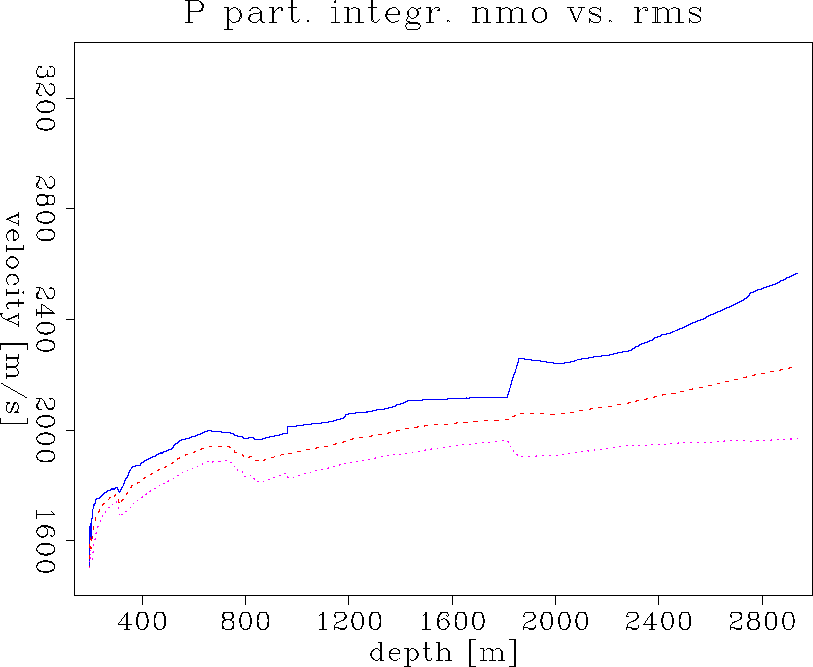 |
Figure 7 shows the Dix rms velocity and the ``wave averaged'' NMO velocity. The solid curve is the Dix rms velocity. The dashed curve is the horizontal NMO velocity vxpnmo calculated using §+M partial integration. The dotted curve is the corresponding vertical NMO velocity vzpnmo. A marine surface seismic observation measures vertical velocity at zero offset and normal moveout velocity vxpnmo from a finite offset range. As we can see in Figure 7, there is only a small difference at small depth, but growing disagreement with depth. The §+M derived curves are always lower than the Dix rms velocity, as expected. The Dix rms velocity is a high frequency approximation satisfying Fermat's principle and thus provides us with the minimum travel time.
 |
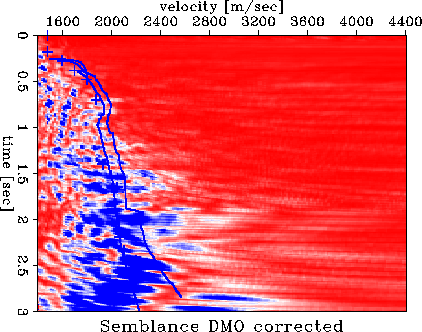 |
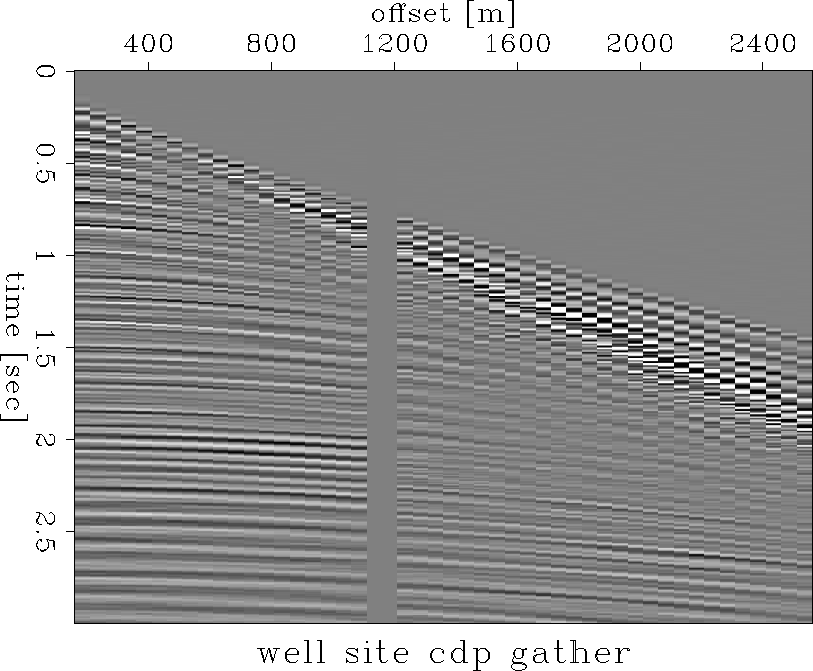
The crucial test however is to compare those curves to actual surface seismic data. Figure 8 shows a CMP gather right at the well site. Figure 9 shows a semblance velocity analysis of that same gather. Overlain are the two estimated velocity curves. The left most is the NMO velocity derived from the §+M partially integrated stiffness log, while the right most curve is the Dix rms velocity. The velocity analysis is using only the raw data with a divergence correction, no other processing is applied. The multiples show up very strong in the semblance panel. Some primaries are visible and §+M derived NMO velocity curves follow pretty close some primary semblance peaks at times less than 2.0 seconds. The Dix rms velocity seems off the semblance peaks to higher values, except for the water bottom reflection and close arrivals. Both curves miss a primary peak at around 1.5 seconds. This is a reflection from a dipping interface. Thus the velocity is shifted towards higher values than predicted using a horizontal layer assumption. Below the target around 2.0 seconds the peaks are shifted again towards higher values. Layers at that depth exhibit progressively steeper dips. The high contrast at the target zone gives rise to strong interbed multiples.
I summarize the velocity relationships for matching surface seismic velocity analysis with well log observations. Relationships between direct propagation velocity are:
| vrmsp = vxp > vzp | (3) |
The rms velocity is derived from Fermat's principle (high frequency approximation) and thus has to fulfill the least travel time condition. The rms velocity is therefore higher than the vertical and horizontal NMO velocities. vxpnmo and vxznmo are not necessarily least traveltime, they are derived from low frequency elastic constants and relate to the wave front curvature at small offsets, but additionally those velocities include effects caused by the micro structure of the medium, like multiple bounces and they are not least travel time measurements. Relationships between NMO velocities are:
| vrmsp > vxpnmo > vzpnmo | (4) |
 |
(5) | |
| (6) | ||
| (7) | ||
| (8) |
 |
Figure 10 shows the results we obtained using Dix rms and the §+M partial integration to relate well log measurements to surface seismic velocity analyses. Generally the §+M predicted velocity is closer to the velocity picks. The largest difference in prediction by using rms velocities is 15 percent, while §+M predictions are in the order of a few percent.
The previous examples all compare NMO and stacking velocities implying that the wave averages for that quantity with very large wave length. It appears from the results that for velocity analysis the wave propagation effects tend to be better described using a low frequency averaging approach than a high frequency averaging approach.