|
|
|
|
Identifying reservoir depletion patterns from production-induced deformations with applications to seismic imaging |
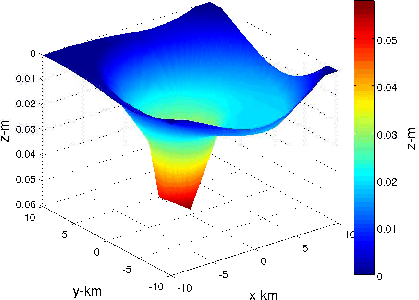
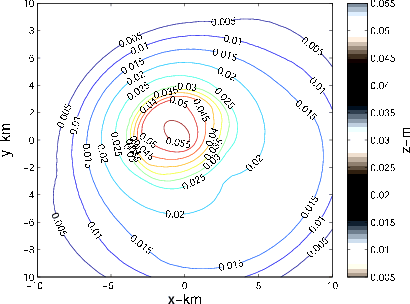
In this section we describe the result of applying our inversion technique to estimating pore pressure decline from the measurements of subsidence for the reservoir described in Segall et al. (1994). Note that the subsidence data in (Segall et al., 1994) was one-dimensional, along the northwest-southeast line, so we extrapolated the data smoothly between the opposite azimuths (see Fig 8(a) and Fig 8(b)).
|
|---|
|
subslacqsimulated,csubslacqsimulated
Figure 8. a) Subsidence data from the Lacq reservoir, extrapolated onto a plane from northwest-southeast profile described in (Segall et al., 1994). b) Contour plot of Fig 8(a). |
|
|
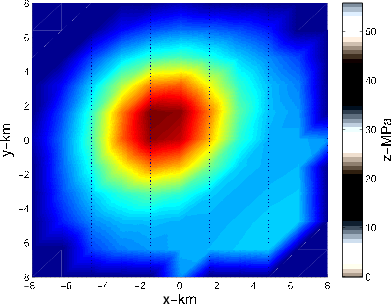
Since only the vertical displacement at the surface is known to us, we use the option of the inversion tool (see Appendix B) that constrains the modelled displacement components to just the vertical component. The result of running 2 iterations of our inversion algorithm on an
 grid is shown on Fig 9(a),9(b). Results of the subsequent refinement in 2 more iterations over the
 grid is shown on Fig 10(a),10(b).
|
|---|
|
pinvertedLporeoutlacqlowres,cinvertedLporeoutlacqlowres
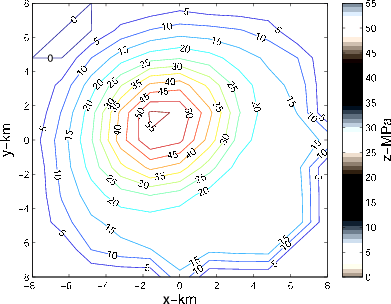
Figure 9. a) Pore pressure decline inverted from the subsidence of Fig 8(b) on a sparse
grid after 2 solver iterations. b) Contour plot of the inverted pore pressure decline of Fig 9(a).
|
|
|
|
|---|
|
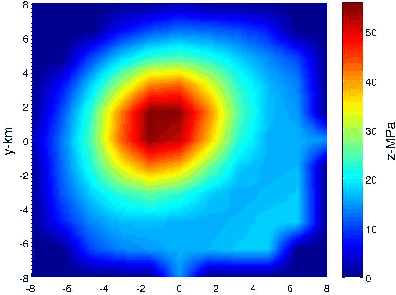
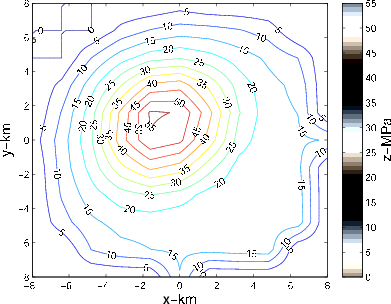
pinvertedLporeoutlacqhires,cinvertedLporeoutlacqhires
Figure 10. a) Pore pressure decline inverted from the subsidence of Fig 8(b) on a denser
grid after 2 more solver iterations (total 4). b) Contour plot of the inverted pore pressure decline of Fig 10(a).
|
|
|
And finally, and most importantly, the symmetrized part of the reconstructed pore pressure drop is in excellent agreement with the input parameters of the symmetric pore pressure profile used in (Segall et al., 1994) to (approximately) model the same subsidence data but using an axisymmetric pressure decline model. In particular, the peak pore pressure drop of 55 MPa at the end of the study period has been reconstructed precisely.
|
|
|
|
Identifying reservoir depletion patterns from production-induced deformations with applications to seismic imaging |