|
|
|
|
Reverse-time migration using wavefield decomposition |
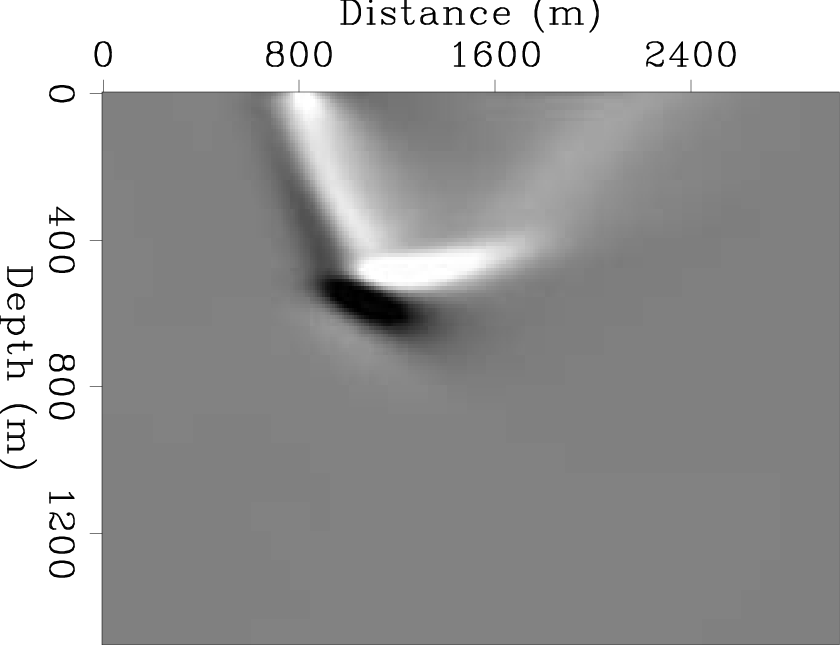
Figure 8(e) illustrates the RTM image corresponding to Equation 8, i.e. the vertical backscatter-based imaging condition. As shown in the figure, the horizontal reflector has been imaged well. However, there are artifacts at shallow depths resulting from those in Figure 8(b).
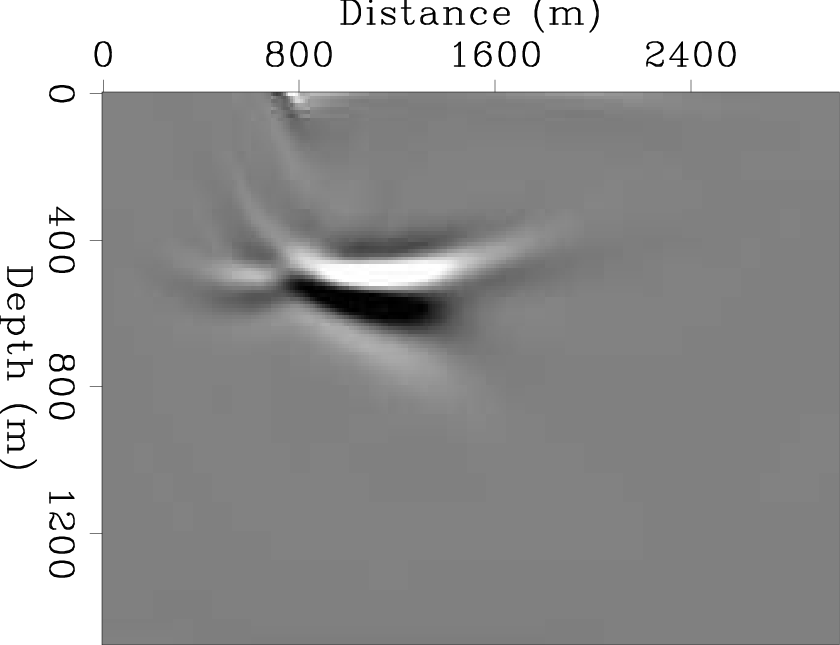
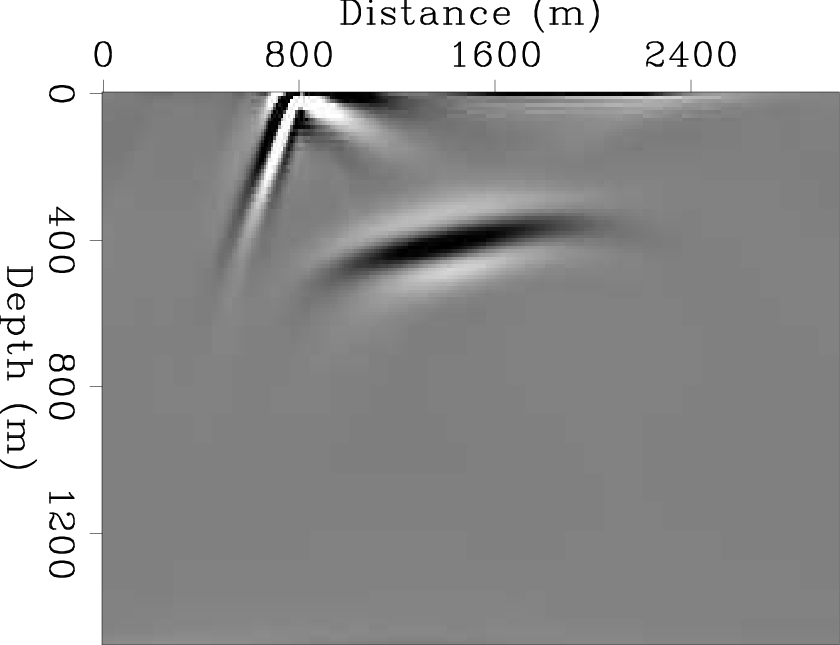
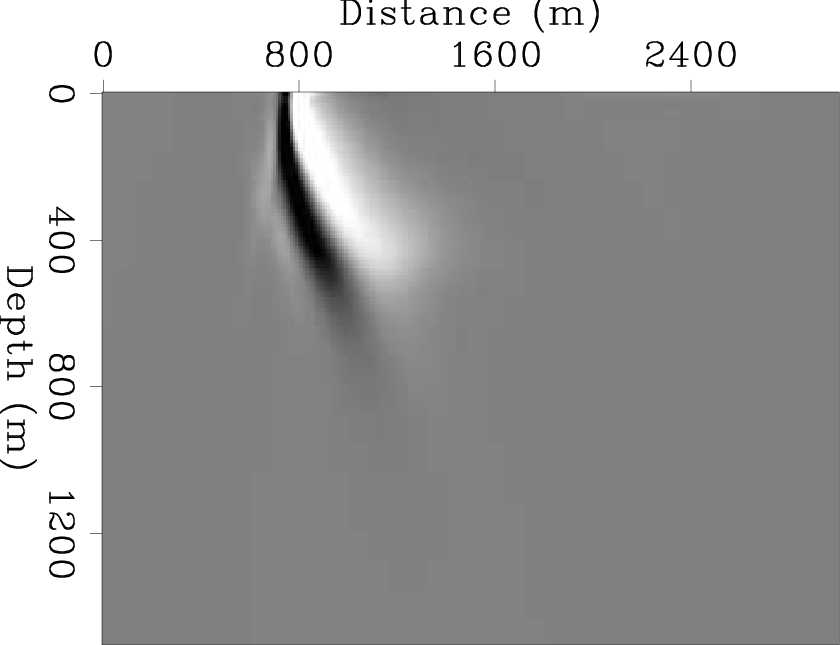
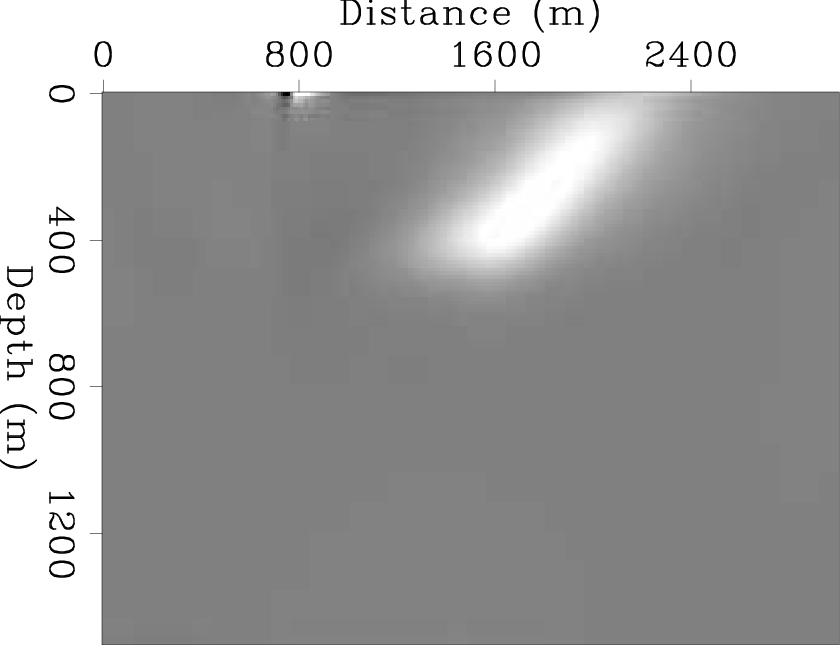
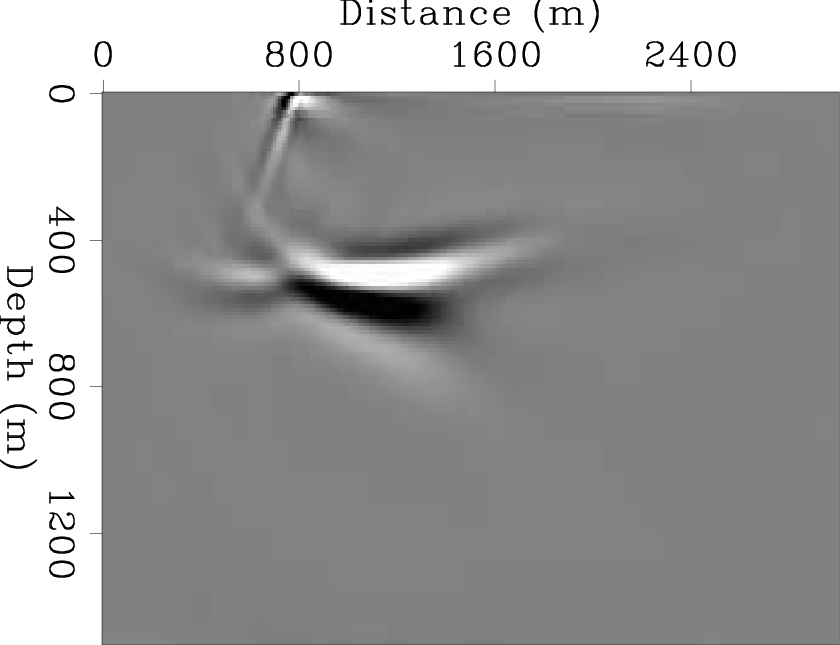
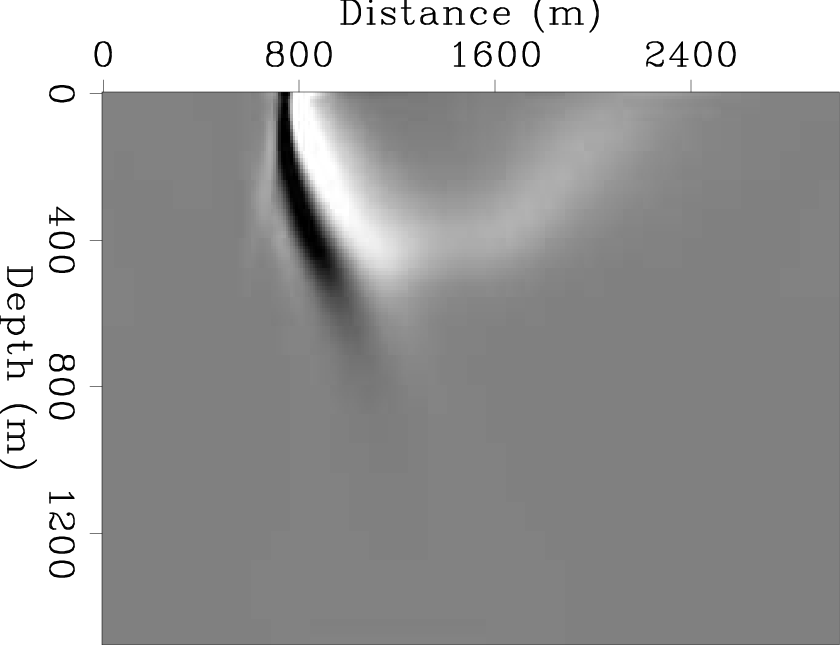
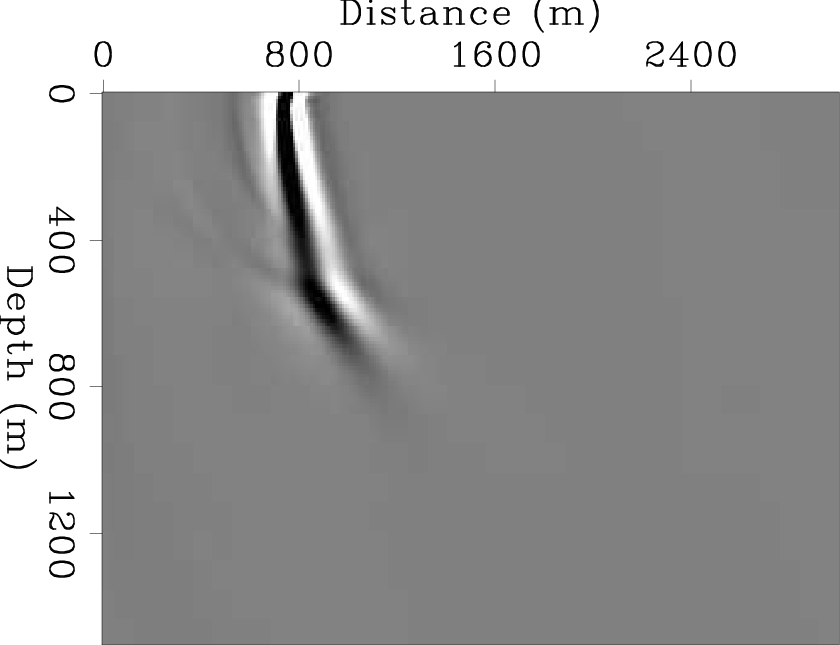
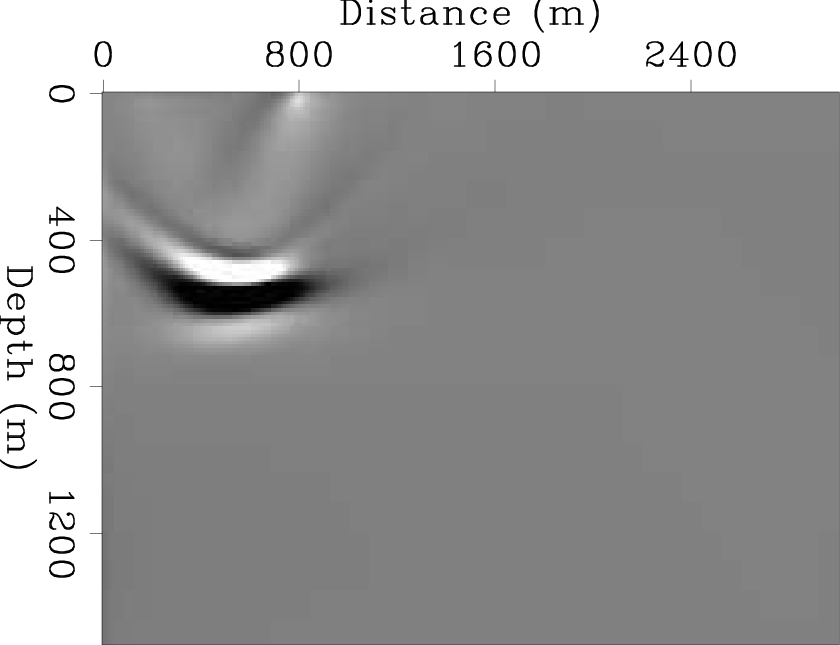
On the other hand, Figures 9(a) to 9(d) show the four horizontally different decomposed RTM images from a single shot profile without SRM corresponding to the model in Figure 2(a). Figure 9(e) illustrates the RTM image using the horizontal backscatter-based imaging condition as in Equation 9. The figure shows strong artifacts aligned vertically above the reflector. These artifacts have a similar origin as those in Figure 8(b), i.e. cross-correlation between the downgoing direct source wavefield and the backscattered receiver wavefield. Specifically, the component of the source wavefield that cause severe artifacts indeed propagates in almost vertical directions, where the leftgoing and rightgoing components of the source wavefield overlap.
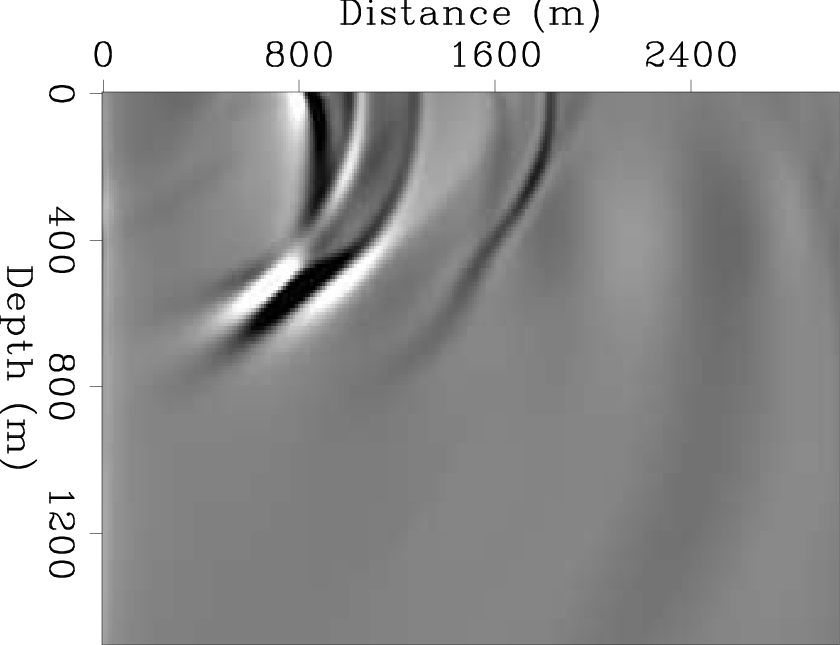
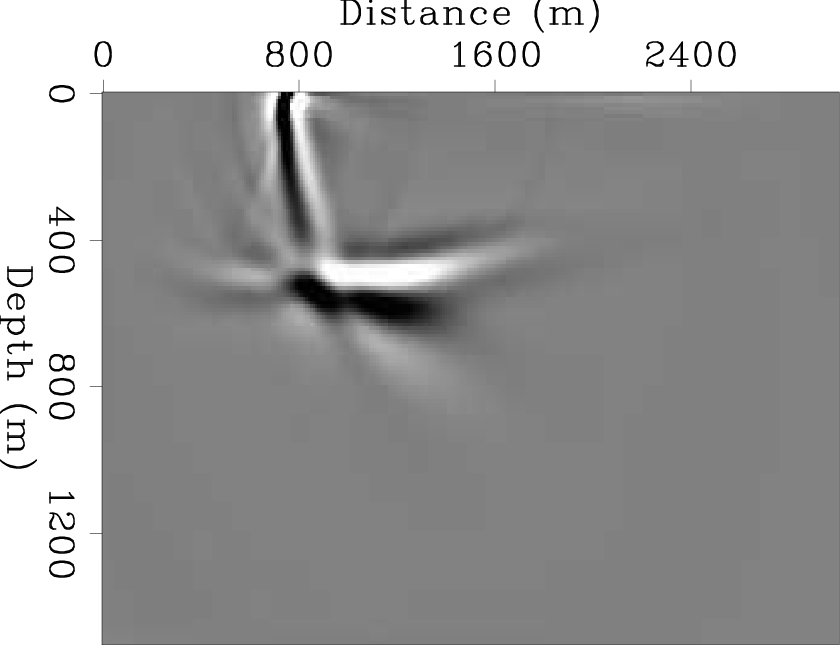
Figure 10 illustrates the sum of the vertical and horizontal backscatter-based imaging conditions (Equations 10), i.e. the Cartesian backscatter-based imaging condition. As shown in the figure, the RTM artifacts at shallow depths have been attenuated except for the vertically aligned artifacts. These severe artifacts result from the cross-correlation between direct source wavefields and backscattered receiver wavefields. It can be seen that the RTM image using wavefield decomposition as in Figure 10 contains less artifacts compared to the conventional RTM image as in Figure 5(b). However, there is no significant improvement when comparing Figure 10 to the image after applying a low-cut filter (Figure 6).
|
|---|
|
v0-SdRu,v0-SuRd,v0-SdRd,v0-SuRu,v0-SdRuPSuRd,v0-SdRdPSuRu
Figure 8. Different vertically decomposed RTM images from the single shot profile in Figure 4(a) along with smooth migration velocity in Figure 5(a): (a) using the downgoing source and upgoing receiver wavefields, (b) using the upgoing source and downgoing receiver wavefields, (c) using the downgoing source and downgoing receiver wavefields, and (d) using the upgoing source and upgoing receiver wavefields. (e) The sum of the images (a) and (b) equivalent to Equation 8. (f) The sum of the images (c) and (d). |
|
|


|
|---|
|
v0-SrRl,v0-SlRr,v0-SrRr,v0-SlRl,v0-SrRlPSlRr,v0-SrRrPSlRl
Figure 9. Different horizontally decomposed RTM images from the single shot profile in Figure 4(a) along with smooth migration velocity in Figure 5(a): (a) using the rightgoing source and leftgoing receiver wavefields, (b) using the leftgoing source and rightgoing receiver wavefields, (c) using the rightgoing source and rightgoing receiver wavefields, and (d) using the leftgoing source and leftgoing receiver wavefields. (e) The sum of the images (a) and (b) equivalent to Equation 9. (f) The sum of the images (c) and (d). |
|
|
|
v0-vertPhoriz
Figure 10. The RTM image from the Cartesian backscatter-based imaging condition as in Equation 10, i.e. the sum of Figure 8(e) and Figure 9(e). |
|
|---|---|
|
|
|
|
|
|
Reverse-time migration using wavefield decomposition |