|
|
|
|
Applications of the generalized norm solver |
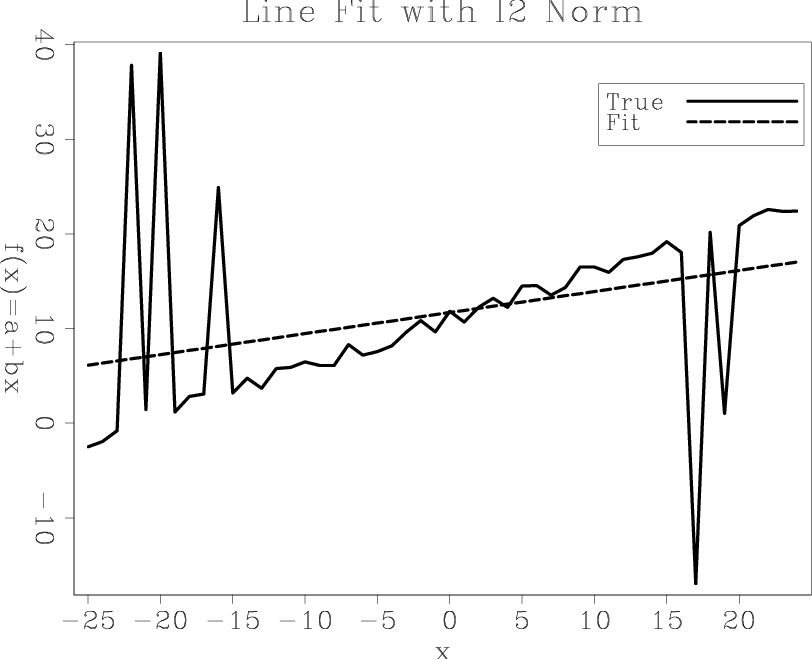
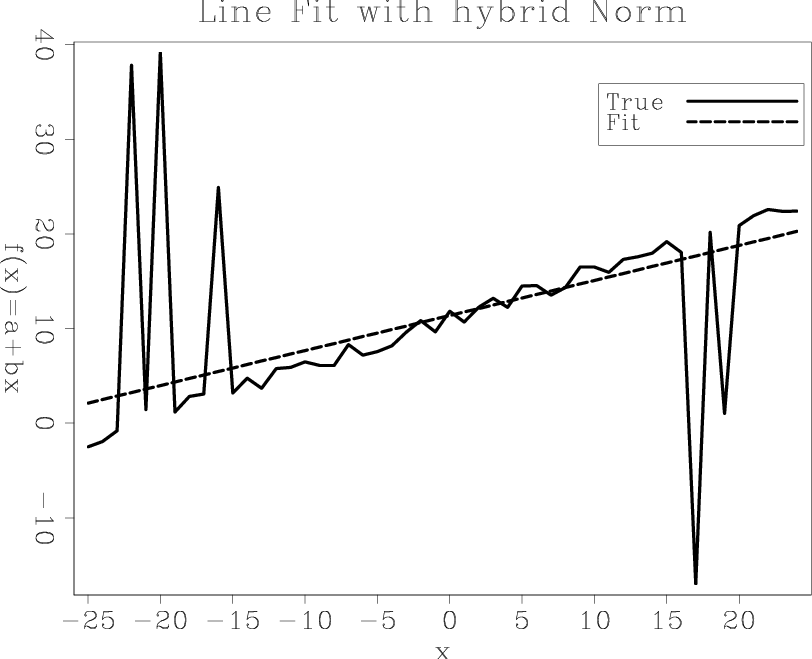
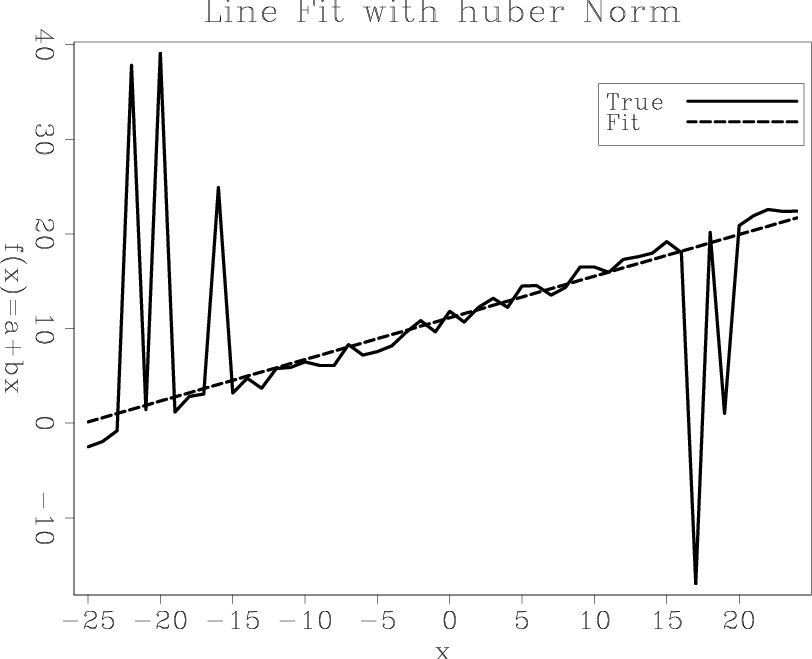
The results of solving this problem with the least-squares, hybrid, and Huber norms are shown in Figure 1. We can see that the fitted line in the L2 norm deviates from the true line due to the presence of spiked data, whereas for the Huber solver and the hybrid solver, the fitted line correctly overlaps the true line. We conclude that our trivial line-fitting example functions properly when using the ![]() -type hybrid and Huber norms.
-type hybrid and Huber norms.
|
|---|
|
fit-l2,fit-hybrid,fit-huber
Figure 1. Line fitting using the generalized norm solver: (a) |
|
|
|
|
|
|
Applications of the generalized norm solver |