next up previous print clean
Next: Anisotropic velocity spectra computation Up: Computation of anisotropic velocity Previous: Computation of anisotropic velocity

Synthetics example

We compute the velocity spectra with the set of anisotropic Thomsen parameters of the Taylor Sand ($\epsilon=0.110, \delta=-0.035$) described in (11). After computing the impulse response of a flat reflector with the preceding parameters, we migrate the data with different inaccurate velocity models and then compute the ADCIGs and anisotropic velocity spectra.

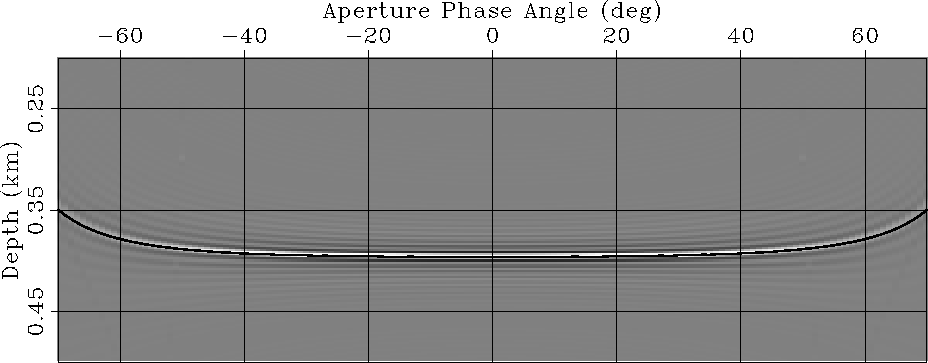
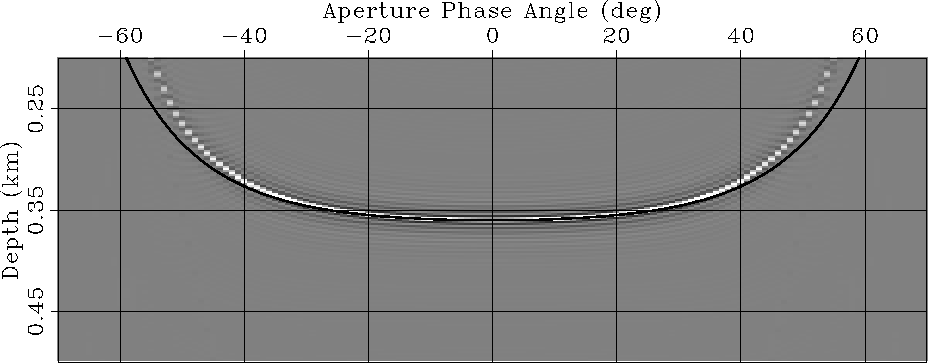
The two inaccurate migration velocity models we use are anisotropic migrations using uniform perturbations equal to 0.99 and 0.9. The ADCIGs obtained from the different migration velocities are illustrated in figures 4 and 5. Superimposed are the predicted RMO curves derived from the linearized expression. The figures demonstrate the accuracy of the linearized approximation for small perturbations.

 
Aniso-rmo-rho.99-flat
Figure 4
ADCIGs obtained when a constant anisotropic velocity was perturbed by $\rho_V=0.99$.
Aniso-rmo-rho.99-flat
view burn build edit restore

 
Aniso-rmo-rho.9-flat
Figure 5
ADCIGs obtained when a constant anisotropic velocity was perturbed by $\rho_V=0.9$.
Aniso-rmo-rho.9-flat
view burn build edit restore


next up previous print clean
Next: Anisotropic velocity spectra computation Up: Computation of anisotropic velocity Previous: Computation of anisotropic velocity
Stanford Exploration Project
1/16/2007