


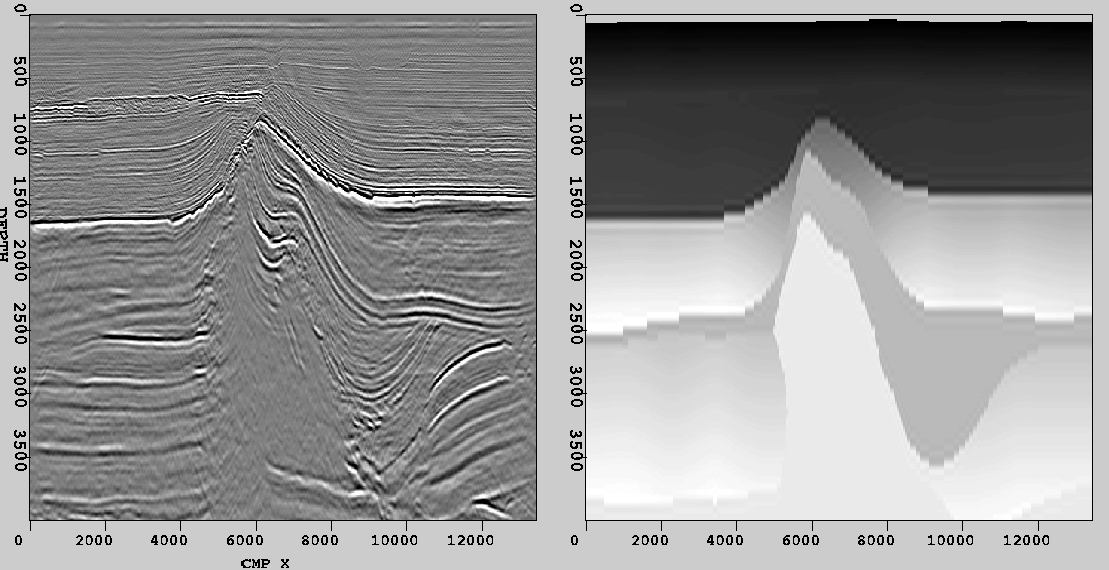
High and low-frequency volumes intrinsically convey different types of geophysical information which are often analyzed together. Fig. 1 shows slices of a high-frequency, seismic volume and a corresponding low-frequency, velocity volume on the left and right, respectively. Although users can try to visually match localized structures on the left to large-scale patterns on the right, it would be easier and more accurate to study a single volume that superimposes the localized structures on the background patterns. Our intended approach is a form of feature-level image data-fusion, the synthesis of a single image using features from multiple source images Bloch and Maitre (1997).
 |

 |
Differences between the two source volumes can also be understood in the spatial-frequency domain. Let ![]() and
and ![]() denote the high and low-frequency volumes, respectively, where
denote the high and low-frequency volumes, respectively, where ![]() is a vector of dimensionality M that ranges over the entire data space. Similarly, let
is a vector of dimensionality M that ranges over the entire data space. Similarly, let ![]() and
and ![]() denote the M-dimensional Fourier transforms of
denote the M-dimensional Fourier transforms of ![]() and
and ![]() , where
, where ![]() is a vector ranging over the entire spatial-frequency space. Spectrum
is a vector ranging over the entire spatial-frequency space. Spectrum ![]() can be separated into two regions: a low-frequency region containing mainly the gray background and a high-frequency region containing the fine structures. Similarly,
can be separated into two regions: a low-frequency region containing mainly the gray background and a high-frequency region containing the fine structures. Similarly, ![]() can be divided into a low-frequency region containing the patterns we want and a high-frequency region almost void of content.
can be divided into a low-frequency region containing the patterns we want and a high-frequency region almost void of content.
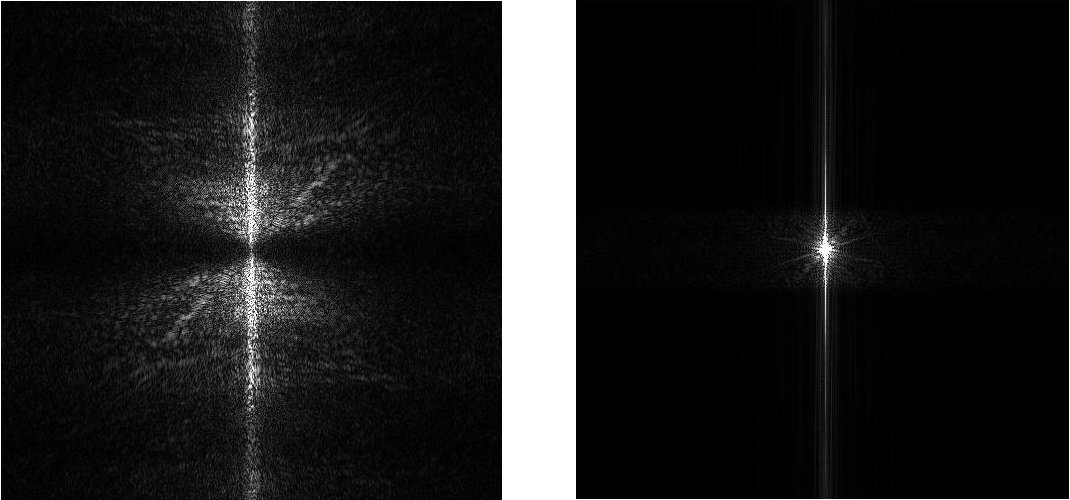
These facts are confirmed in Fig. 2, which shows the magnitude spectra of the slices from Fig. 1. In this example, ![]() is nearly zero in all high-frequency regions except around the vertical line w1 = 0, where the regional boundaries in
is nearly zero in all high-frequency regions except around the vertical line w1 = 0, where the regional boundaries in ![]() introduce high-frequency components. If we add the high-frequency components of
introduce high-frequency components. If we add the high-frequency components of ![]() to
to ![]() , we would synthesize a new volume that approximately has the background patterns of
, we would synthesize a new volume that approximately has the background patterns of ![]() and the foreground details of
and the foreground details of ![]() .
.
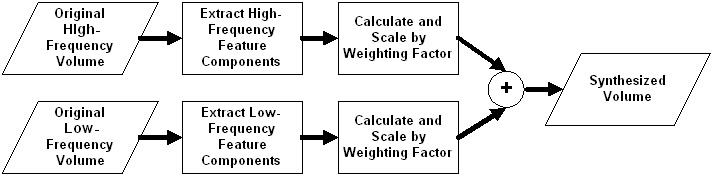
The two data-fusion algorithms presented in Sections 2.2-2.3 follow the framework depicted in Fig. 3. High and low-frequency components are extracted from the two source volumes. These components are properly scaled and added together to form the new volume. The framework can also be used to develop other frequency-selective data-fusion algorithms.
 |