


Next: [8] The convergence of
Up: [3] The meaning and
Previous: [6] The resolution of
In probability theory, the cost function is defined as Tarantola (1984)
|  |
(91) |
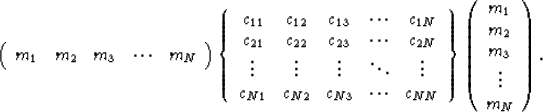
where CD and CM are the covariance matrices for the data sets and models respectively. It is relatively easy to analyze the role of the covariance matrix CM. The second term of equation (91) can be expressed in the following matrix form:
|  |
(92) |
The vector  represents a stochastic process. The covariance matrix CM stands for the linear relation of the stochastic process at two different times. If the value of the covariance is very small, the stochastic process at the two different times changes a little. Therefore, the uncertainty of the stochastic process is also low. Small values are chosen for the elements in the matrix CM if we have enough a priori information of the model.
The similarity between two images produced by two successive iterative migration/inversion steps are used to generate the covariance matrix. The correlation coefficients of the two images can be used to fill the covariance matrix CM. Of course, the reciprocal of the correlation coefficients of the two images can be used to fill the covariance matrix CM-1.
The local singular values (from SVD) of an image reflect the local continuity of an event, which can be used for constraints.
represents a stochastic process. The covariance matrix CM stands for the linear relation of the stochastic process at two different times. If the value of the covariance is very small, the stochastic process at the two different times changes a little. Therefore, the uncertainty of the stochastic process is also low. Small values are chosen for the elements in the matrix CM if we have enough a priori information of the model.
The similarity between two images produced by two successive iterative migration/inversion steps are used to generate the covariance matrix. The correlation coefficients of the two images can be used to fill the covariance matrix CM. Of course, the reciprocal of the correlation coefficients of the two images can be used to fill the covariance matrix CM-1.
The local singular values (from SVD) of an image reflect the local continuity of an event, which can be used for constraints.
Next: [8] The convergence of
Up: [3] The meaning and
Previous: [6] The resolution of
Stanford Exploration Project
11/1/2005