


 |
The data set was acquired in the Gulf of Mexico
over an existing reservoir.
Therefore several borehole seismic data sets
were available in addition to the surface data
to constraint the estimation of the anisotropic parameters.
ExxonMobil provided SEP with three anisotropic-parameter
cubes resulting from a joint inversion of the surface data
and the borehole data
Krebs et al. (2003).
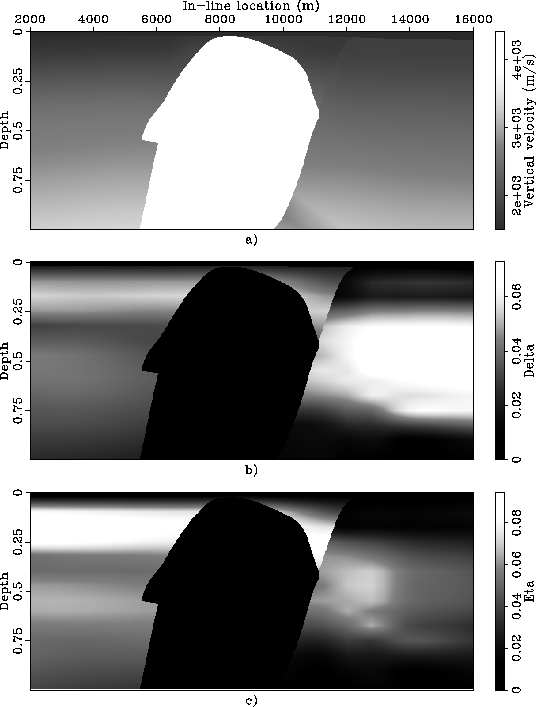
Figure ![[*]](http://sepwww.stanford.edu/latex2html/cross_ref_motif.gif) shows
the vertical slices cut through these cubes
at the cross-line location corresponding to the 2-D line
that I migrated.
Panel a) displays the vertical velocity,
panel b) displays the values of
shows
the vertical slices cut through these cubes
at the cross-line location corresponding to the 2-D line
that I migrated.
Panel a) displays the vertical velocity,
panel b) displays the values of ![]() ,and
panel c) displays the values of
,and
panel c) displays the values of ![]() .To avoid artifacts caused by sharp parameter contrasts,
for migration I removed the salt body from
the functions displayed in
Figure .
I ``infilled'' the salt body
with sediment-like values by interpolating
the functions inward starting from the sediment values
at the salt-sediment interface.
.To avoid artifacts caused by sharp parameter contrasts,
for migration I removed the salt body from
the functions displayed in
Figure .
I ``infilled'' the salt body
with sediment-like values by interpolating
the functions inward starting from the sediment values
at the salt-sediment interface.
 |
.
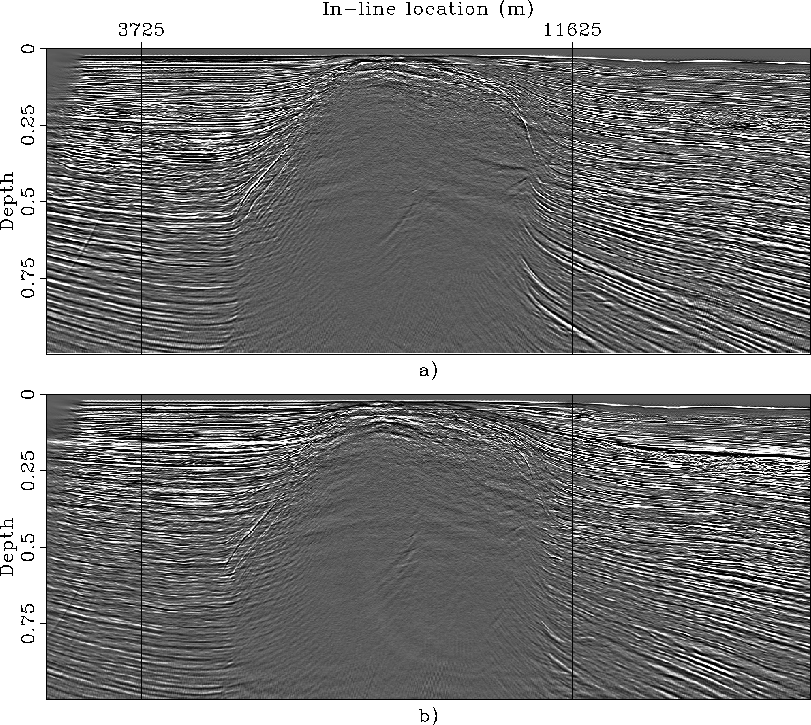
Figure
compares the result of anisotropic prestack depth migration
(panel a) with the results of isotropic depth migration
obtained using as migration velocity the vertical velocity function (panel b).
The anisotropic-migration image is clearly superior
to the isotropic-migration image that shows clear sign of undermigration
of the salt-flanks reflections as well of the sediments terminating against the salt body.
All the reflectors are nicely imaged by the anisotropic migration,
except for the shallow tract of the salt flank on the left-hand side of the body
because it has large cross-line dip components.
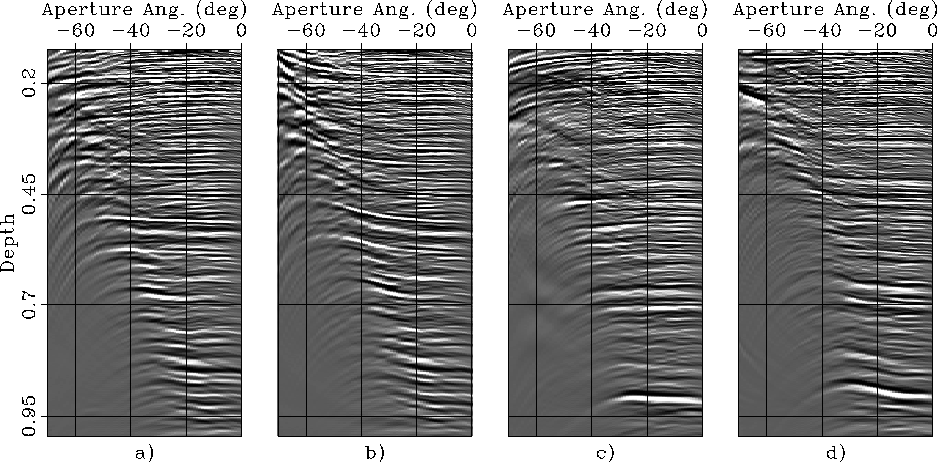 |
Figure shows two examples of
ADCIGs computed from both the anisotropic and the isotropic migration results.
The CIGs shown in panel a) and b) are taken
at surface location of 3,725 meters
(left vertical black line in Figure )
and
the CIGs shown in panel c) and d) are taken
at surface location of 11,625 meters
(right vertical black line in Figure ).
The ADCIGs obtained by anisotropic migration (panels a and c)
are uniformly flatter than the ADCIGs obtained by isotropic migration (panels b and d).
The ADCIGs obtained by isotropic migration display the typical hockey-stick behavior
commonly seen in CIGs computed by isotropic Kirchoff migration in anisotropic media.
Although the isotropic migration image is evidently not well focused,
this result does not preclude the possibility that
an isotropic migration velocity could be defined
to focus the data satisfactorily.
However, an isotropic migration with a different velocity model would
also position the reflectors at substantially different locations.
These location would not equally match the depth measured from the wells
Bear et al. (2003).
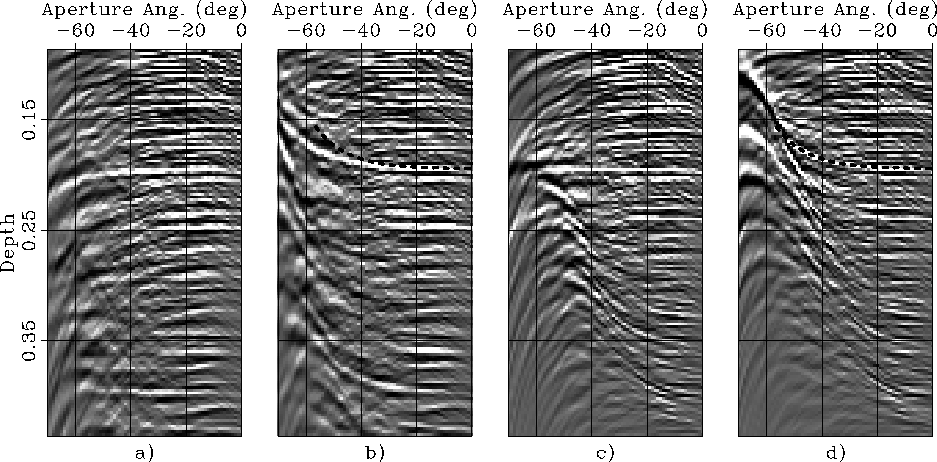
The RMO function derived in this paper assumes a homogeneous
layer above the reflector to be analyzed.
To test the accuracy of the expressions for the RMO function
I therefore estimated the average anisotropic parameters
between the sea floor and two reflectors,
one shallow and the other deep,
easily identifiable
in the ADCIG located at 3,725 meters
(Figure a).
Figures and
show the result of my analysis.
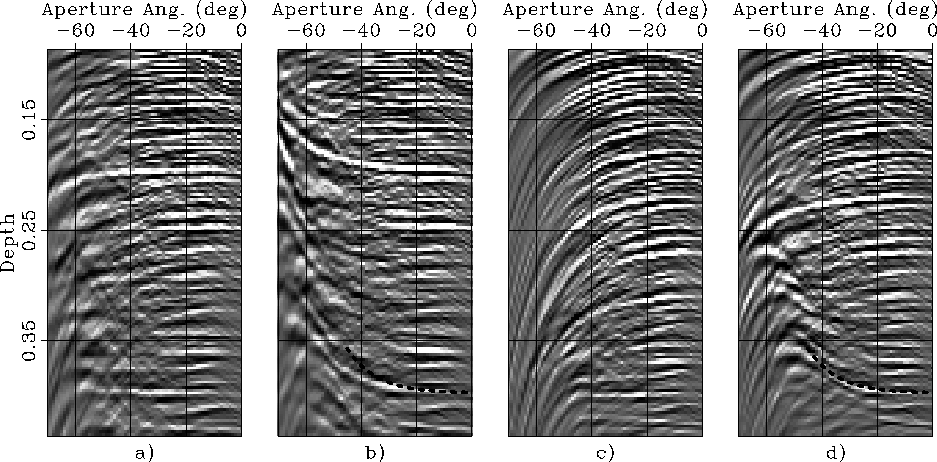
Figure c shows
the ADCIG obtained after anisotropic migration
using the following average parameters below the sea floor:
![]() .Figure d shows
the ADCIG obtained after isotropic migration using
.Figure d shows
the ADCIG obtained after isotropic migration using ![]() .The shallow reflection of interest is flat in
Figure c, whereas it is smiling upward
in Figure d.
For comparison,
Figures a and b
show a zoom of
Figures a and b
into the same window of the ADCIGs as the one displayed in
Figures c and d.
The curve superimposed onto both
Figures b and d
was computed using the generalized RMO functions expressed
in equations 24-26.
The computed RMO function perfectly overlaps the event in the ADCIG
in Figure d.
In contrast, the computed RMO function overestimates the moveout
in the ADCIG obtained by migrating the data using the original isotropic model
(Figure b).
The cause of this discrepancy is the ray bending induced
by the vertical gradient in the original heterogeneous model.
Because of ray bending the events propagate more vertically,
and thus more slowly,
in the heterogeneous medium than in the homogeneous one.
In cases when explicit raytracing though the background
velocity is necessary to compute the RMO function,
equation 27 provides the necessary link
between the traveltime perturbations accumulated along the rays
and the depth perturbations measured in the ADCIGs.
.The shallow reflection of interest is flat in
Figure c, whereas it is smiling upward
in Figure d.
For comparison,
Figures a and b
show a zoom of
Figures a and b
into the same window of the ADCIGs as the one displayed in
Figures c and d.
The curve superimposed onto both
Figures b and d
was computed using the generalized RMO functions expressed
in equations 24-26.
The computed RMO function perfectly overlaps the event in the ADCIG
in Figure d.
In contrast, the computed RMO function overestimates the moveout
in the ADCIG obtained by migrating the data using the original isotropic model
(Figure b).
The cause of this discrepancy is the ray bending induced
by the vertical gradient in the original heterogeneous model.
Because of ray bending the events propagate more vertically,
and thus more slowly,
in the heterogeneous medium than in the homogeneous one.
In cases when explicit raytracing though the background
velocity is necessary to compute the RMO function,
equation 27 provides the necessary link
between the traveltime perturbations accumulated along the rays
and the depth perturbations measured in the ADCIGs.
The ADCIGs shown in Figure
display a behavior similar to the ones shown in
Figure .
Since the reflection of interest is now deep,
the half-space below the sea floor is characterized
by higher average parameters than for the shallow reflection;
that is:
![]() .As before, the reflection of interest in ADCIG migrated using these parameters
(Figure c) is flat,
whereas the same reflection in the ADCIG migrated with isotropic migration
with the same vertical velocity (
.As before, the reflection of interest in ADCIG migrated using these parameters
(Figure c) is flat,
whereas the same reflection in the ADCIG migrated with isotropic migration
with the same vertical velocity (![]() )is smiling upward
(Figure d).
As before, the RMO curve computed using
equations 24-26
perfectly overlaps the event in the ADCIG shown
in Figure d,
whereas it overestimates the moveout in the ADCIG obtained by migrating
the data using the original isotropic model
(Figure b).
)is smiling upward
(Figure d).
As before, the RMO curve computed using
equations 24-26
perfectly overlaps the event in the ADCIG shown
in Figure d,
whereas it overestimates the moveout in the ADCIG obtained by migrating
the data using the original isotropic model
(Figure b).
 |
 |


