Next: Analytical evaluation of the
Up: Kinematic analysis of ADCIGs
Previous: Kinematic analysis of ADCIGs
Integral migration can be conceptually
performed by spreading the data along spreading
surfaces as well as by summing data along the summation surfaces
discussed above.
The spreading surfaces are duals of the summation surfaces
and represent the impulse response
of the migration operator.
In homogeneous anisotropic medium
the shape
of the impulse responses of
the generalized integral migration
can be easily evaluated analytically
as a function of the subsurface offset
 , in addition to the usual
image depth
, in addition to the usual
image depth  and midpoint
  .Figure
 ![[*]](http://sepwww.stanford.edu/latex2html/cross_ref_motif.gif) illustrates the geometry used to evaluate this impulse response.
Notice that the angles in this figure
(
illustrates the geometry used to evaluate this impulse response.
Notice that the angles in this figure
( and
and  ) are missing a tilde
because they are group angles,
and not phase angles as in the previous section.
In an isotropic medium these angles are the dip and aperture angles,
but in an anisotropic medium these angles
are not easily related to the
geological dip and the reflection aperture angles.
They can be thought of as convenient parameters
to evaluate the impulse response.
) are missing a tilde
because they are group angles,
and not phase angles as in the previous section.
In an isotropic medium these angles are the dip and aperture angles,
but in an anisotropic medium these angles
are not easily related to the
geological dip and the reflection aperture angles.
They can be thought of as convenient parameters
to evaluate the impulse response.
imp-resp
Figure 2
Geometry used for evaluating the impulse response of the generalized
integral migration.
|
|  |

Simple trigonometry applied to
Figure allows us to express the impulse
response in parametric form, as a function of and .If we migrate an impulse recorded at time tD,
midpoint mD and surface offset hD,
the migration impulse response can be expressed as follows:
|  |
(18) |
| (19) |
| (20) |
with
|  |
(21) |
In a isotropic medium the half path-length L would
be simply given by tD/2S, but
in an anisotropic medium it is function of the angles.
Its two components Ls and Lr can be calculated
by solving the following system of linear equations:
|  |
(22) |
| (23) |
Equation 22 constraints the total traveltime
to be equal to the impulse time,
and equations 23 constraints the depth
of the end point of the two rays (zs and zr) to be equal,
since the subsurface offset is assumed to be horizontal.
The solution of this system of equation yields the following
for the half path-length:
|  |
(24) |
The combination of equation 24
and equations 18-20
enables the evaluation
of the generalized migration impulse response
in a arbitrary homogeneous anisotropic medium.
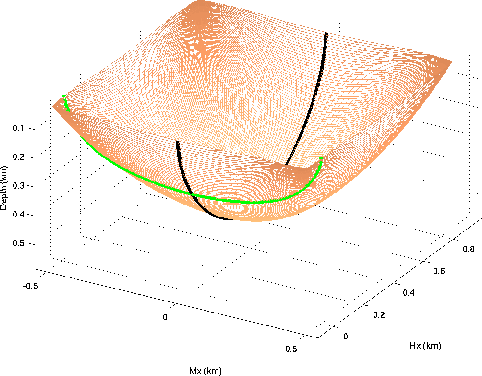
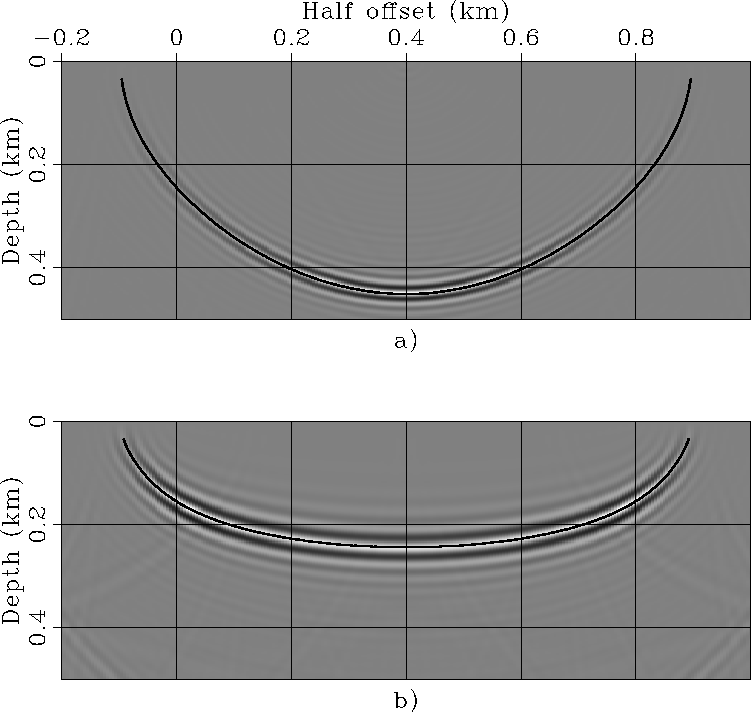
Figure shows
a 3-D rendering of the impulse response computed using
the previous equations
for an impulse
with tD=.9 seconds, mD=0 kilometers,
and hD=.4 kilometers, and vertical slowness SV=1 s/km;
the anisotropy parameters correspond
to the Taylor Sand as listed in the table on page .
The gray line (green in color) superimposed onto the impulse response
is the result of cutting the surface at zero subsurface offset,
and thus corresponds to the conventional
impulse response of prestack migration.
The black line superimposed onto the impulse response
is the result of cutting the surface at zero midpoint.
In Figure
these two lines are superimposed onto the corresponding
vertical sections cut from the images computed
by an anisotropic wavefield source-receiver migration applied with the same
parameters described above.
Figure b shows the conventional
migration impulse response,
whereas Figure a shows the
zero-midpoint section.
The lines computed by applying the kinematic
equations perfectly match the impulse
responses computed using wavefield migration,
confirming the accuracy of the kinematic equations.
surf_taylor_hxd_dot_4
Figure 3
Impulse response of generalized anisotropic prestack migration.
The gray line (green in color) superimposed onto the impulse response
corresponds to the conventional impulse response of prestack migration.


Surf-taylor_hxd_.4-overn
Figure 4
Vertical sections cut from the impulse response computed
by an anisotropic wavefield source-receiver migration.
The lines superimposed onto the images correspond to
the lines superimposed onto the surface shown in
Figure
and are computed by applying
the kinematic expressions presented in
equations 18-24.
|
|  |
Next: Analytical evaluation of the
Up: Kinematic analysis of ADCIGs
Previous: Kinematic analysis of ADCIGs
Stanford Exploration Project
5/3/2005