

Next: Conclusions
Up: Shragge and Biondi: Ray-coordinate
Previous: Methodology
This section presents an example of the ray-coordinate system updating
procedure using the Sigsbee 2A velocity model.
The velocity model, presented in the lower panel of
Figure 2, consists of a typical Gulf
of Mexico v(z) velocity gradient overlain by a rugose salt
body characterized by significantly higher wavespeed.
Ziggy.raycomparison
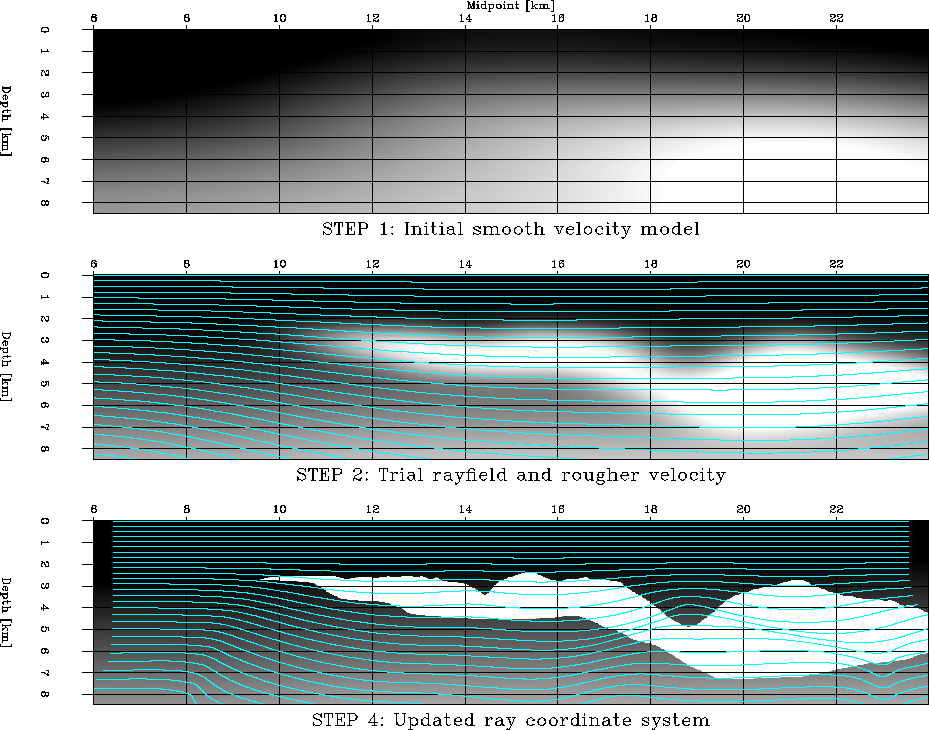
Figure 2 Velocity models and
traced rayfields. Upper panel: smoothed Sigsbee 2A velocity model that
forms the initial velocity model used for tracing an initial
ray-coordinate system. Middle panel: rougher velocity model
used for tracing the updated wavefield. The initial ray-coordinate
system is overlain; Lower panel: updated 5Hz ray-coordinate system
overlying the unsmoothed Sigsbee 2A velocity model.

The first step of the procedure is shown in the upper panel of
Figure 2. The rugosity of the true salt
velocity model leads to a plane-wave rayfield containing
a substantial number of triplications. To avoid this problem, we
iteratively smooth the velocity model with stationary triangular
operators. The velocity model shown in the upper panel is the
roughest model where rays did not cross.
The result of the second step of the procedure, calculating an initial
rayfield, is presented in the middle panel. Here, the rays are
calculated with a Huygens' wavefront tracing procedure
Sava and Fomel (2001).
The third step of the procedure is to extrapolate a monochromatic
wavefield on the initial rayfield generated in the step 2. This is done
using a 5Hz wavefield and the RWE procedure employing the
ray-coordinate 15 equation.
The resulting wavefield, interpolated to Cartesian coordinates, is
shown in the upper panel of Figure 3.
Ziggy.raysoln
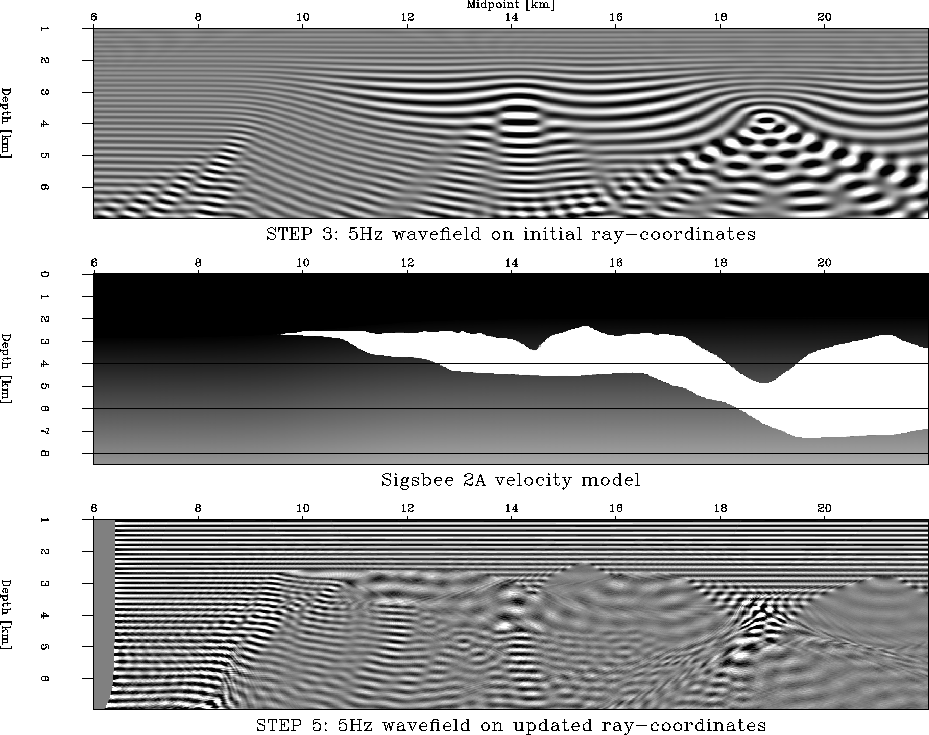
Figure 3 Calculated monochromatic
5Hz wavefields. Upper panel: initial wavefield solution calculated on
initial ray-coordinate system using the rougher velocity model;
Middle panel: Sigsbee 2A velocity model; Lower panel: updated
wavefield solution calculated on updated ray-coordinate system.

The wavefield above and to the left of the salt body is well behaved;
however, beneath the top of the salt boundary it exhibits a
cross-hatched pattern characteristic of the superposition of different
triplication branch phases.
This phenomenon is more evident in the sub-salt regions where the
lens-like focusing effects of the salt are visible.
The fourth step is to compute the phase-rayfield from the monochromatic
wavefield produced in step 3. Results for the 5Hz phase-rayfield
are shown in the lower panel of Figure 2.
The horizontal extent of the computation grid is less than that of the
wavefield in the upper panel, because phase-rays can only be
calculated at locations where the initial wavefield was computed.
The effects of the rougher velocity model are evident in the shorter
wavelength features of the coordinate system.
For example, coordinates in the salt body canyons are delayed relative to
neighboring points inside the salt body, leading to the sharper
corners of the ray-coordinate system below the salt body.
Also, the kink in the rayfield in the lower right corner of the lower
panel is caused by side boundary reflections masquerading as wavefield
triplications.
The fifth step of the procedure, calculating a monochromatic wavefield
on the updated ray-coordinate system, is illustrated in the lower
panel of Figure (3). The resulting wavefield is
full of triplications, and the illumination gaps (areas of low
wavefield intensity) observed by Clapp (2003) are
now plainly visible.
Broadband wavefields computed on the initial and updated ray-coordinate
systems are presented in the upper panels of
Figure 4.
For interest, we include the velocity model mapped into both of these
coordinate systems (lower panels).
The horizontal lines represent surfaces of constant extrapolation
time.
Ziggy.allraysoln
Figure 4 Calculated broadband
wavefield solutions in ray-coordinates (2-20Hz). Upper left panel:
wavefield computed on initial ray-coordinate system; Upper right panel:
wavefield computed on updated ray-coordinate system; Lower left panel:
velocity model mapped to the initial ray-coordinate system; Lower right panel:
velocity model mapped to the updated ray-coordinate system.

The upper panels show the initial plane-wave after propagation from
the surface to depth through the respective velocity models. Results
are presented at three travel-time steps spaced out at one second
intervals. If the coordinate system were perfect, extrapolated
wavefronts would be collinear with the three straight lines.
This would indicate that the wavefront remains perfectly conformal
with the ray-coordinate system. (Diffracted energy, though, moves
sub-parallel to the wavefront and therefore does not form a straight line).
Differences in wavefront curvature between the upper two panels
illustrate that the angles formed between the wavefront and
extrapolation axes have, indeed, changed. In particular, they are now
greater on the left side than on the right, which is not surprising
because our goal is creating a coordinate system more conformal with
the wavefront orientation.
(Recall that a decreased extrapolation angle corresponds to increased
operator fidelity.)
This improved alignment, though, does come at a cost: the flanks of
the canyon between 17 and 20km in midpoint are now steeper than in the
original velocity model.
This means that extrapolation across the salt flanks is now less robust
because the salt flank angles are too severe.
A result of this problem is observable in the less realistic
extrapolated wavefield in the salt canyon between 2-3s in time and 17
and 20km in midpoint.
From this example, we point out that the ability to create a
ray-coordinate system actually leads to an extra degree of freedom in
the extrapolation process.
As a result, the practitioner must resolve the trade-off between how
well a wavefront conforms with the ray-coordinate system and how steep
the structural dips of the velocity model are mapped as a result.
Thus, one must ask the question: is it better to account for the
steepest structural dips in the velocity model, but with lower
extrapolation accuracy? or is it better to handle only shallower
structural dips but with greater accuracy? Our conjecture is that the
answer lies somewhere between these two end members and strongly
depends on the particular velocity model in question.
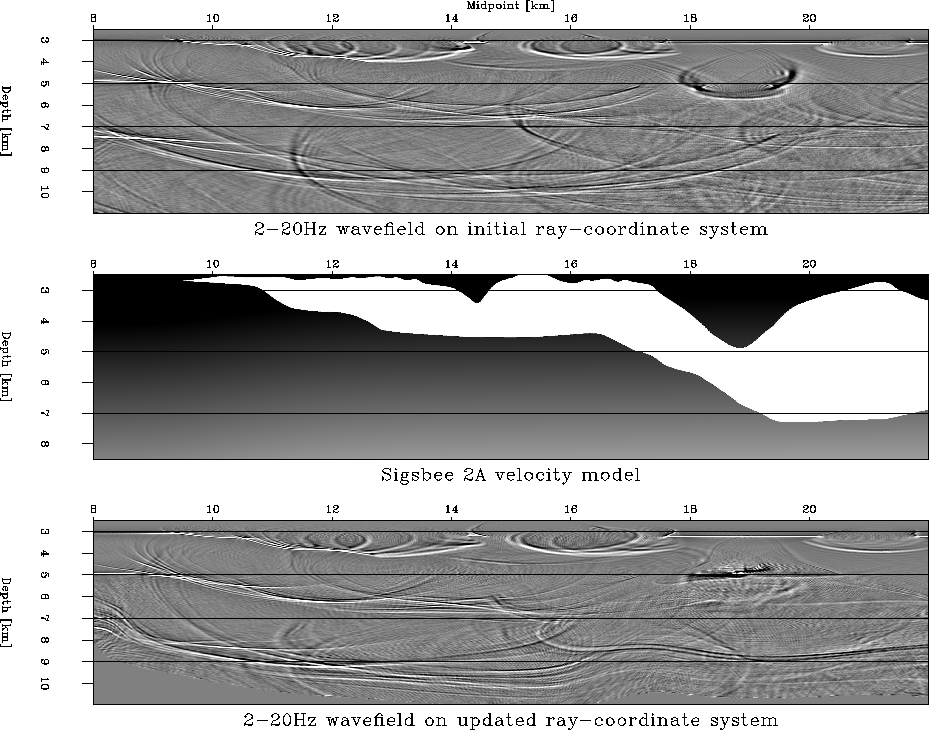
The wavefields of Figure 4, interpolated to a
Cartesian basis, are presented in Figure 5.
Ziggy.allcartsoln
Figure 5 Calculated broadband
wavefield solutions in Cartesian coordinates (2-25Hz). Upper panel:
wavefield calculated on initial ray-coordinate system; Middle
panel: Sigsbee 2A velocity model; lower panel: wavefield calculated
on a updated ray-coordinate system.

The upper and lower panels present the broadband extrapolation results
computed using the initial and updated ray-coordinate systems,
respectively.
Snapshots of the wavefields at the first depth level is fairly
similar; however, the second and third are markedly different.
The wavefield in the lower panel at the fourth snapshot is more
continuous across the breadth of the computational grid.
However, beneath the salt canyon described above, the
extrapolated wavefields in the upper panel seem to be more
representative of the expected propagation results. This lack of
global improvement is an example of the trade-off discussed above.


Next: Conclusions
Up: Shragge and Biondi: Ray-coordinate
Previous: Methodology
Stanford Exploration Project
5/23/2004


