Our first example is designed to illustrate our method
in a fairly simple model. We use a 2-D model with
horizontal and vertical gradients
![]() m/s which gives waves
propagating from a point source a pronounced
tendency to overturn
(Figure 2).
The model also contains a diffractor located
around x=3800 m and z=3000 m.
m/s which gives waves
propagating from a point source a pronounced
tendency to overturn
(Figure 2).
The model also contains a diffractor located
around x=3800 m and z=3000 m.
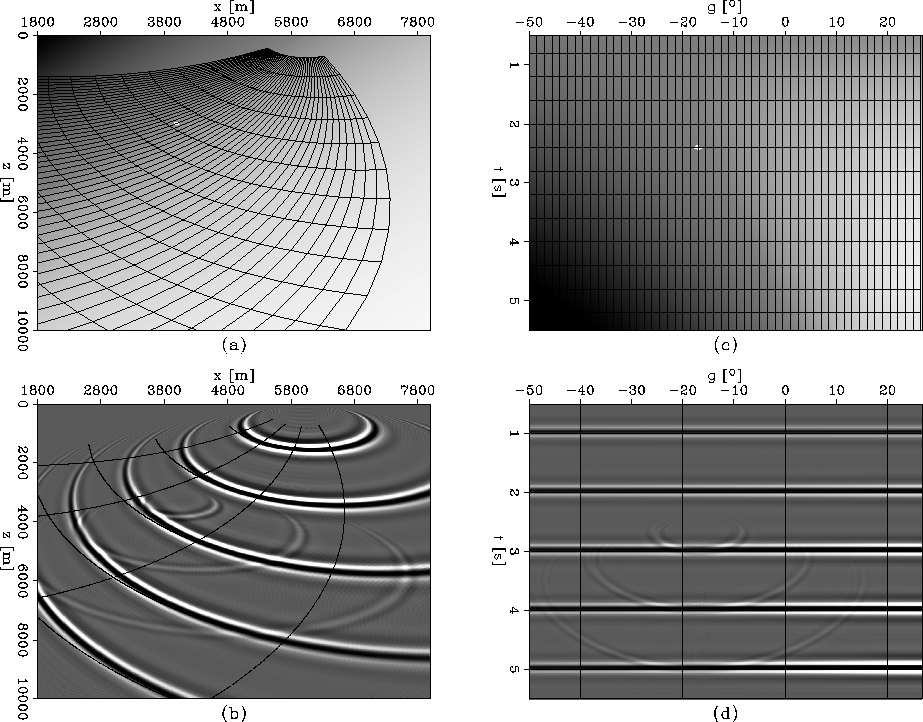
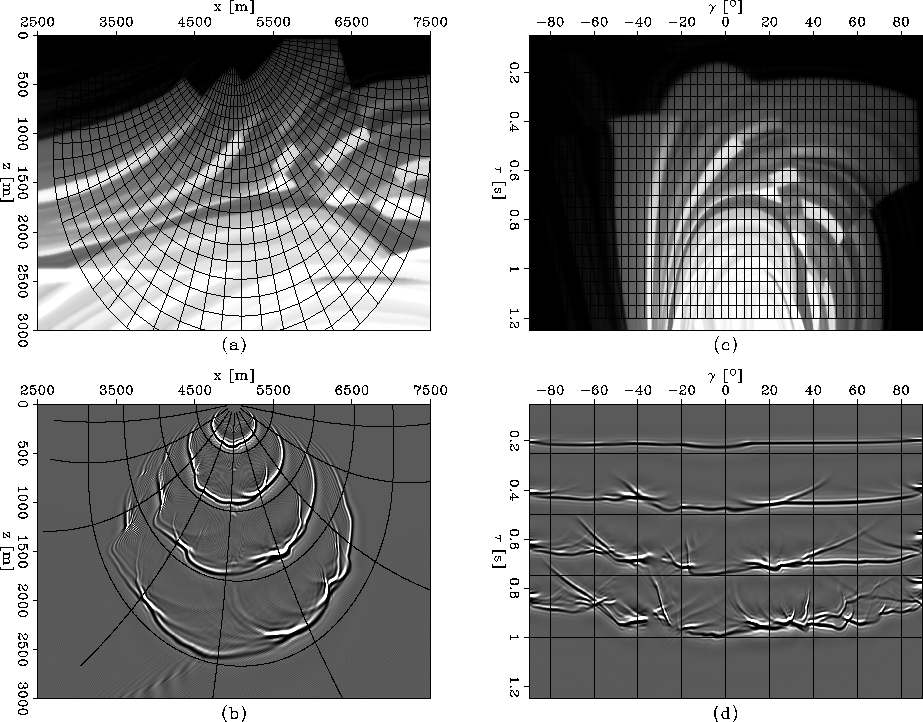
We use ray tracing to create an orthogonal
ray coordinate system corresponding to a point
source on the surface at x=6000 m.
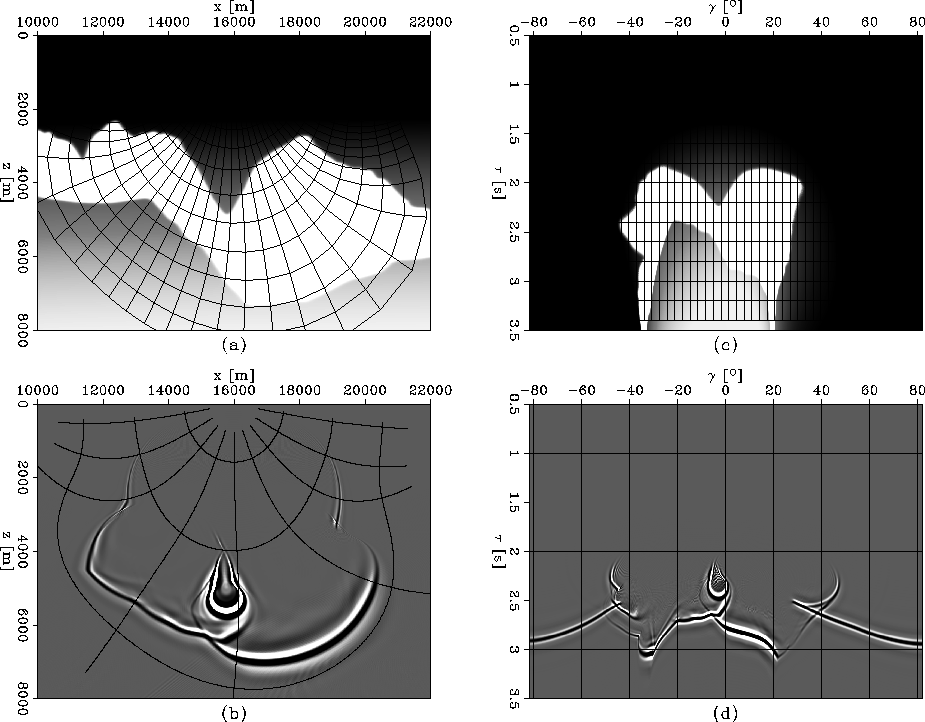
Figure 2(a) shows the velocity
model and the rays in the original Cartesian
coordinate system (x,z).
Figure 2(c) shows the velocity
model mapped into the ray coordinate system (![]() ).
The diffractor is mapped to
).
The diffractor is mapped to ![]() s and
s and
![]() measured from the vertical.
The synthetic data we use is represented by
impulses at the source location at every 0.25 s.
In ray coordinates, this source is represented by a
plane-wave evenly distributed over all
shooting angles
measured from the vertical.
The synthetic data we use is represented by
impulses at the source location at every 0.25 s.
In ray coordinates, this source is represented by a
plane-wave evenly distributed over all
shooting angles ![]() .Ideally, an image obtained by migrating such a dataset
is a representation of the acoustic wavefield
produced by a source which pulsates periodically.
.Ideally, an image obtained by migrating such a dataset
is a representation of the acoustic wavefield
produced by a source which pulsates periodically.
Figure 2(b)
shows the image obtained by downward continuation
in Cartesian coordinates
using the standard ![]() equation.
Figure 2(d)
shows the image obtained by wavefield extrapolation
in ray coordinates using the equivalent
equation.
Figure 2(d)
shows the image obtained by wavefield extrapolation
in ray coordinates using the equivalent ![]() equation.
The overlays in panels (b) and (d) are
wavefronts at every 0.25 s and rays shot at
every
equation.
The overlays in panels (b) and (d) are
wavefronts at every 0.25 s and rays shot at
every ![]() to facilitate one-to-one
comparisons between the images in ray and Cartesian
coordinates.
to facilitate one-to-one
comparisons between the images in ray and Cartesian
coordinates.
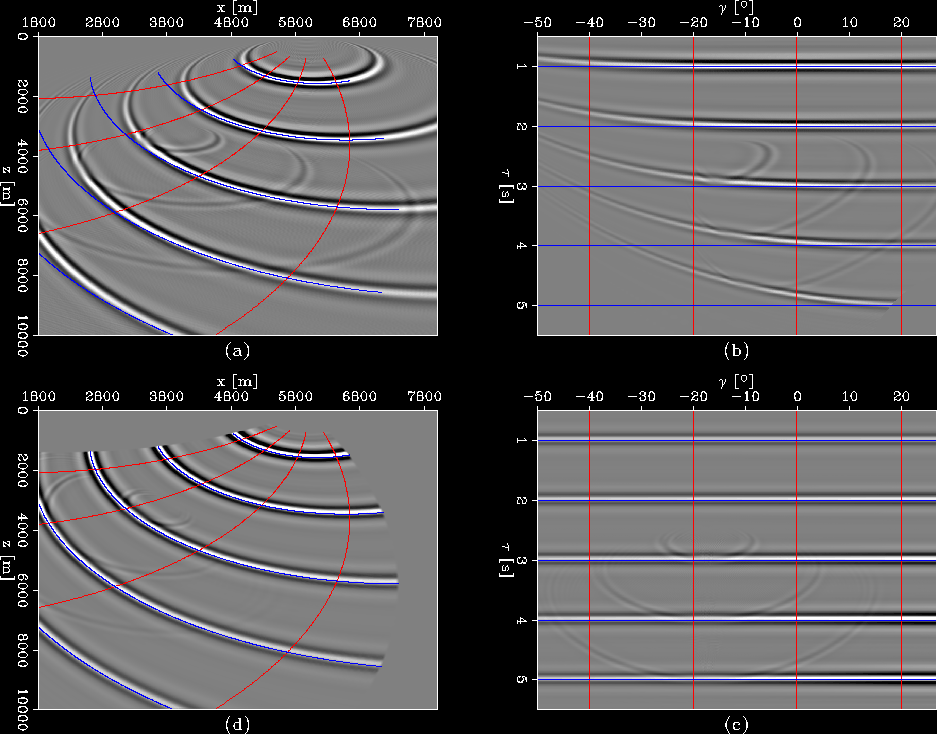
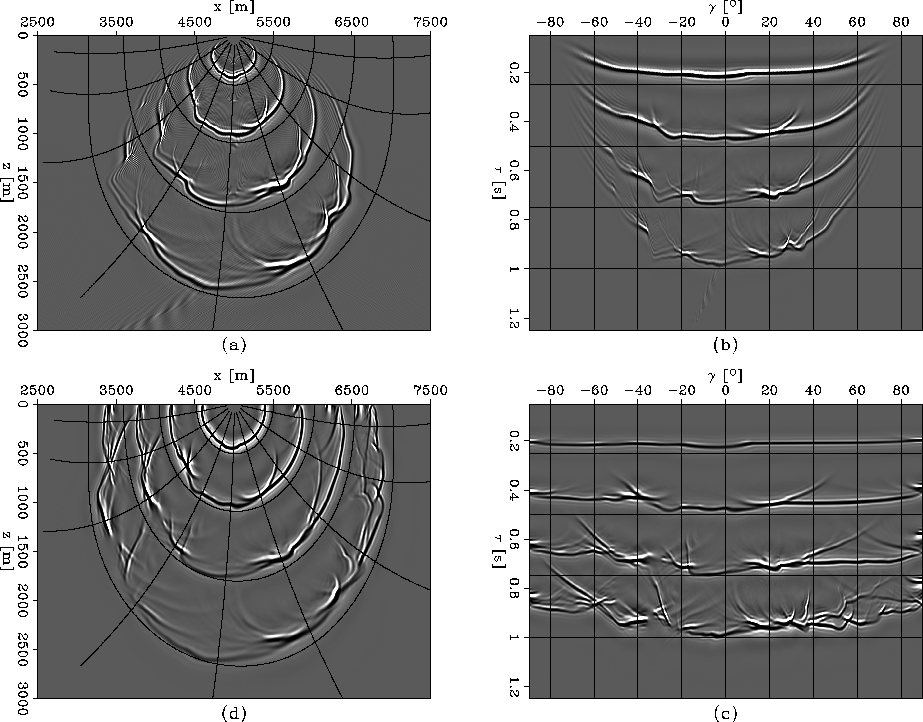
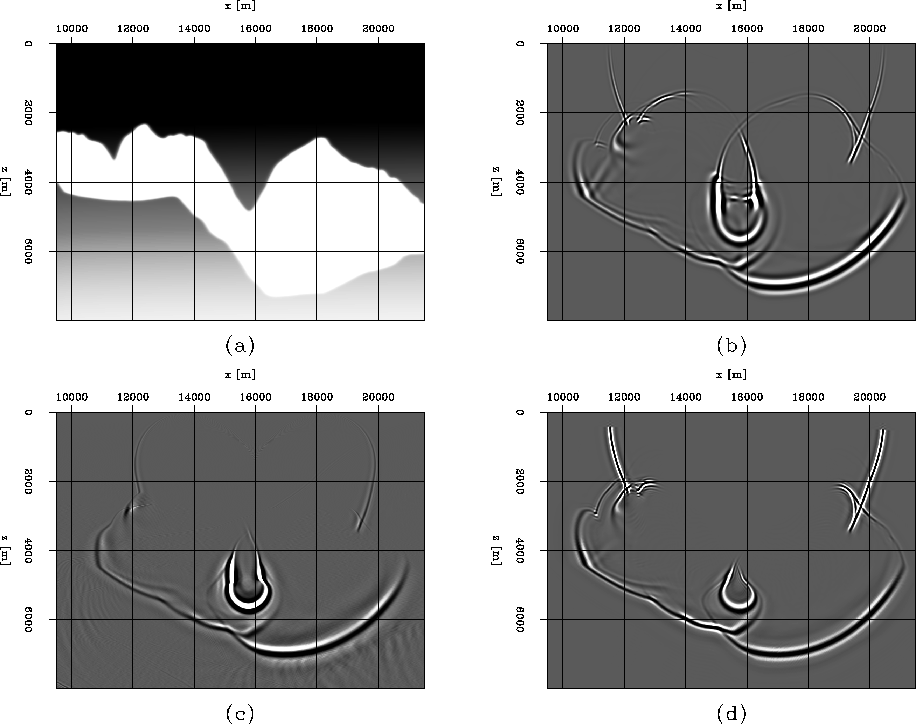
Figure 3 is a direct comparison
of the results obtained by extrapolation in the two
coordinate systems.
The image created by extrapolation in Cartesian
coordinates (a) is mapped to ray coordinates (b).
The image created by extrapolation in ray coordinates (c)
is mapped to Cartesian coordinates (d).
Since we use the same velocity for ray tracing and
for wavefield extrapolation, we expect the
wavefields and the overlain wavefronts to be in
agreement. The most obvious mismatch occurs in regions
where the ![]() equation fails to extrapolate
correctly at steep dips (around
equation fails to extrapolate
correctly at steep dips (around ![]() .This is not surprising since, as its name indicates,
this equation is only accurate up to
.This is not surprising since, as its name indicates,
this equation is only accurate up to ![]() .However, this limitation is eliminated in
ray coordinates, because the coordinate system
brings the extrapolator in a reasonable position
and at a good angle,
although the extrapolator uses an equation of a
similar order of accuracy.
.However, this limitation is eliminated in
ray coordinates, because the coordinate system
brings the extrapolator in a reasonable position
and at a good angle,
although the extrapolator uses an equation of a
similar order of accuracy.
Another interesting observation in Figures 3 (a) and (d) concerns the diffractor we introduced in the velocity model. When we extrapolate in Cartesian coordinates, the diffraction is only accurate to a small angle relative to the extrapolation direction (vertical). In contrast, the diffraction develops relative to the propagation direction when computed in ray coordinates, thus being more accurate after mapping to Cartesian coordinates.
 |
 |
We can also observe that the diffractions created by the anomaly in the velocity model are not at all limited in the ray coordinates domain. In a beam-type approach, such diffraction would not develop beyond the extent of any particular beam which interacts with it. Neighboring beams would be completely insensitive to the presence of the velocity anomaly.
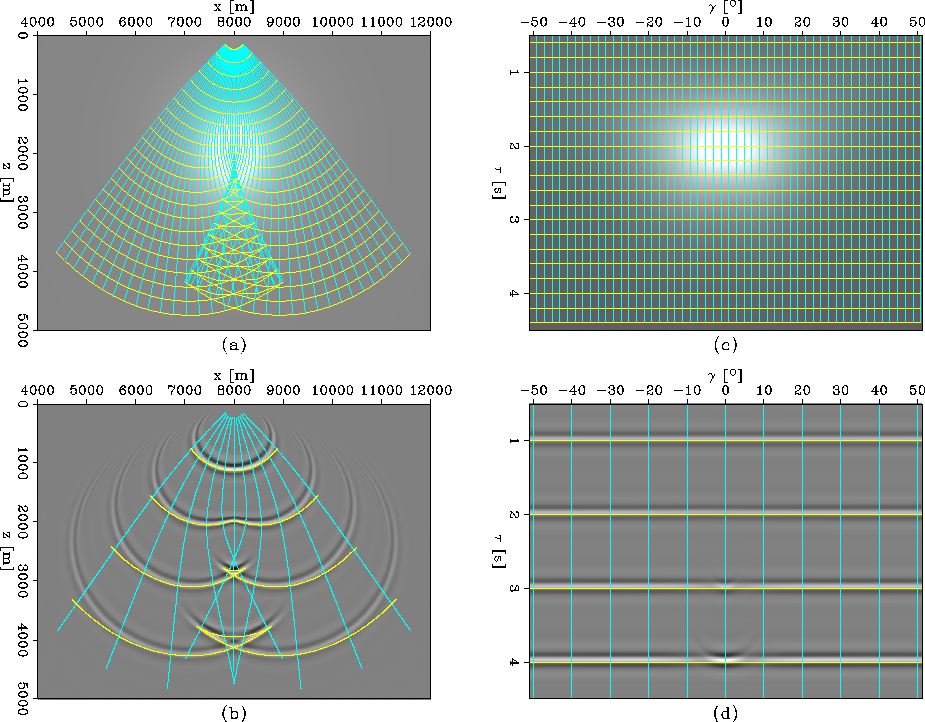
The second example concerns a smooth velocity with a negative Gaussian anomaly which creates a triplication of the ray coordinate system (Figure 4). Everything other than the velocity model is identical to its counterpart in the preceding example. Similarly to Figure 2, panels (a) and (b) correspond to Cartesian coordinates, and panels (c) and (d) correspond to ray coordinates. Using regularization of the ray coordinates parameters, we are able to extrapolate through the triplication. The small discrepancy between the wavefields and the corresponding wavefronts indicate that our method of ray tracing is not perfectly accurate in the triplicating region, and the wavefield extrapolation is correcting for the kinematic differences.
 |
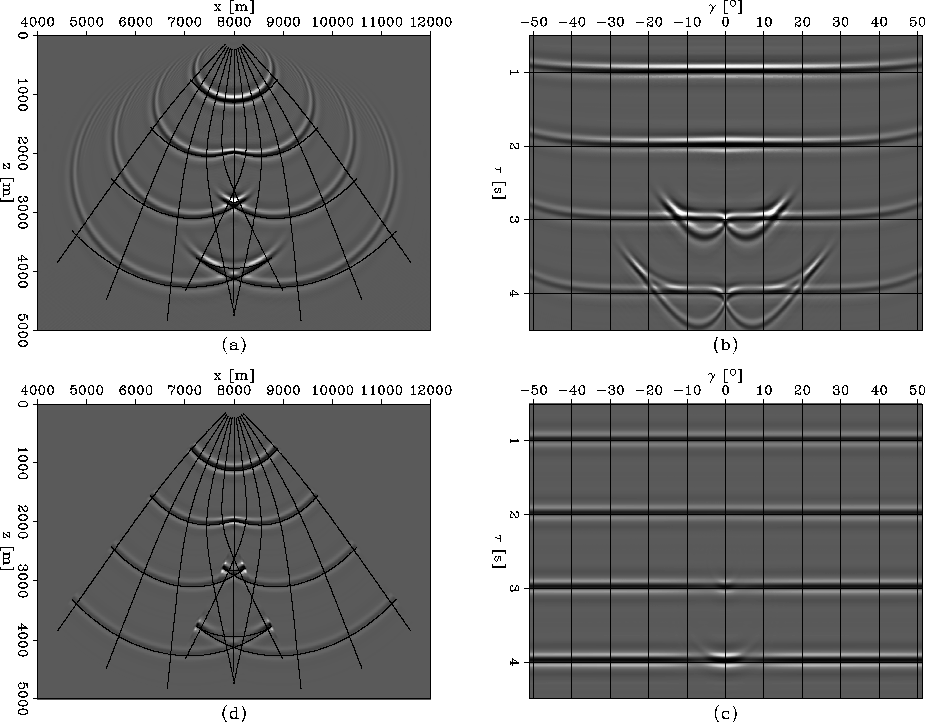 |
Figure 5 is similar to Figure 3. The ``butterfly'' in panel (b) is another indication that the ray coordinate system is triplicating, and different shooting directions pick up the same energy from the wavefield extrapolated in Cartesian coordinates (a). None of this happens when we extrapolate in ray coordinates (c) and interpolate to Cartesian coordinates (d).
Our next example concerns the more complicated Marmousi model. Figure 6 shows the velocity models mapped into the two different domains, and the wavefields obtained by extrapolation in each one of them. We create the ray coordinate system by ray tracing in a smooth version of the model, and extrapolate in the rough version. The source is located on the surface at x=5000 m.
In this example, the wavefields triplicate in
both domains (Figure 7).
Since we are using a ![]() equation,
extrapolation in Cartesian coordinates is only
accurate for the small incidence angles, as
can be seen in panels (a) and (b).
In contrast, extrapolating in ray coordinates
(c) does not have the same angle limitation,
which can also be seen after mapping back to
Cartesian coordinates (d).
equation,
extrapolation in Cartesian coordinates is only
accurate for the small incidence angles, as
can be seen in panels (a) and (b).
In contrast, extrapolating in ray coordinates
(c) does not have the same angle limitation,
which can also be seen after mapping back to
Cartesian coordinates (d).
 |
 |
 |
![[*]](http://sepwww.stanford.edu/latex2html/movie.gif)
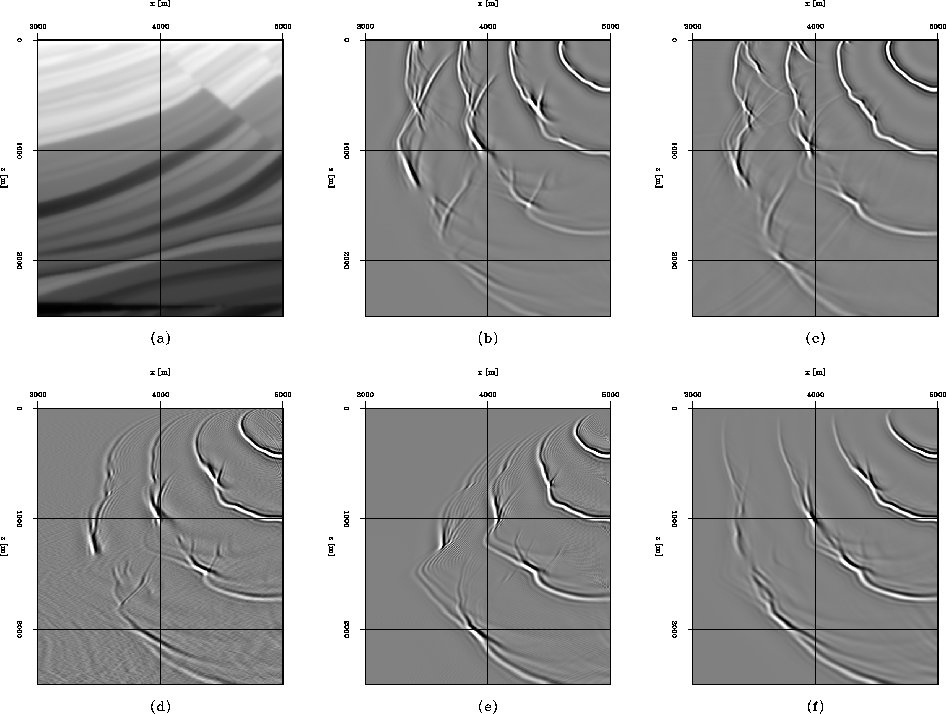
Figure 8 is a close-up
comparison of the wavefields obtained by
extrapolation with different methods in different
domains.
Panel (a) is a window of the velocity model for
reference. Panels (b) and (c) are obtained
by extrapolation in ray coordinates using
the ![]() and split-step equations, respectively.
Panels (d), (e) and (f) are obtained
by downward continuation in Cartesian coordinates
using the
and split-step equations, respectively.
Panels (d), (e) and (f) are obtained
by downward continuation in Cartesian coordinates
using the ![]() ,
, ![]() and split-step
equations, respectively.
The ray coordinates extrapolation results are similar
to the Cartesian coordinates results in the regions
where the wavefields propagate mostly vertically,
but are much better in the regions where the
wavefields propagate almost horizontally.
and split-step
equations, respectively.
The ray coordinates extrapolation results are similar
to the Cartesian coordinates results in the regions
where the wavefields propagate mostly vertically,
but are much better in the regions where the
wavefields propagate almost horizontally.
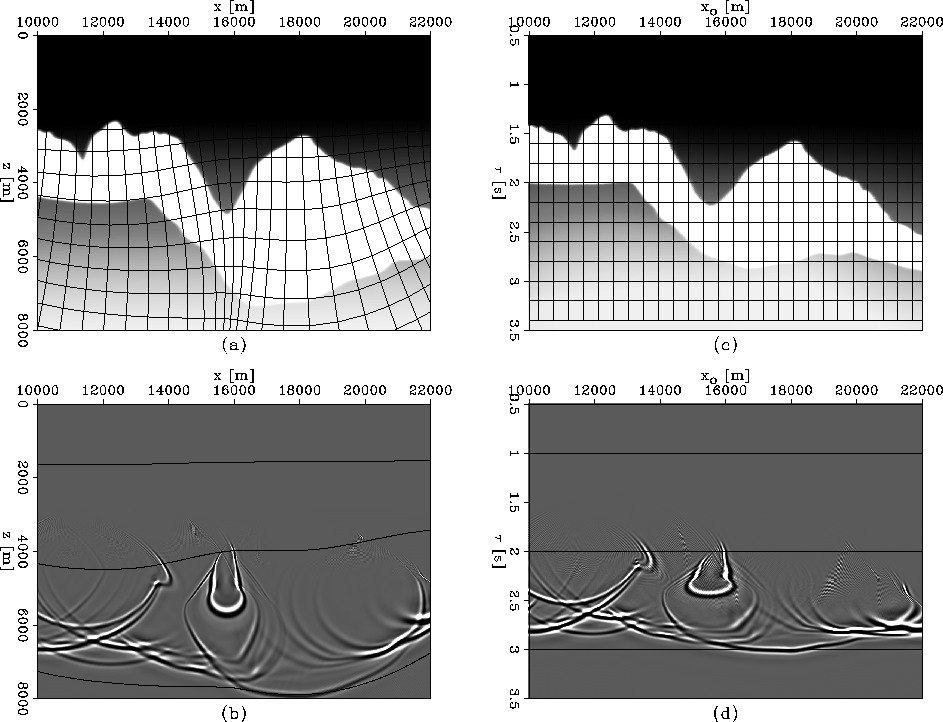
Next, we present another example in the Sigsbee 2A model. We consider two types of ray coordinates: one initiated by a plane wave at the surface (Figure 9), and one initiated by a point source at the surface at x=16000 m. (Figure 10). Similarly to the preceding examples, we observe complicated wavefield propagation, with many triplications, of the extrapolated wavefields.
 |
 |
 |
![[*]](http://sepwww.stanford.edu/latex2html/movie.gif)
Figure 11 is a close-up
comparison of the wavefields obtained by
extrapolation with different methods in
different domains.
Panel (a) is a window of the velocity model
for reference.
Panel (b) is the wavefield obtained by
finite-difference modeling using the two-way
acoustic wave equation. This panel contains
not only waves propagating forward, but also
reflections which are not going to be
modeled in the one-way extrapolation results.
Panel (c) is obtained by downward continuation
in Cartesian coordinates using the ![]() equation, and panel (d) is obtained
by extrapolation in ray coordinates using
the
equation, and panel (d) is obtained
by extrapolation in ray coordinates using
the ![]() equation.
We can observe good match of the forward
propagating wavefields in (b) and (d),
in contrast to the poor match with panel
(c) in the regions of nearly horizontal
propagation.
equation.
We can observe good match of the forward
propagating wavefields in (b) and (d),
in contrast to the poor match with panel
(c) in the regions of nearly horizontal
propagation.
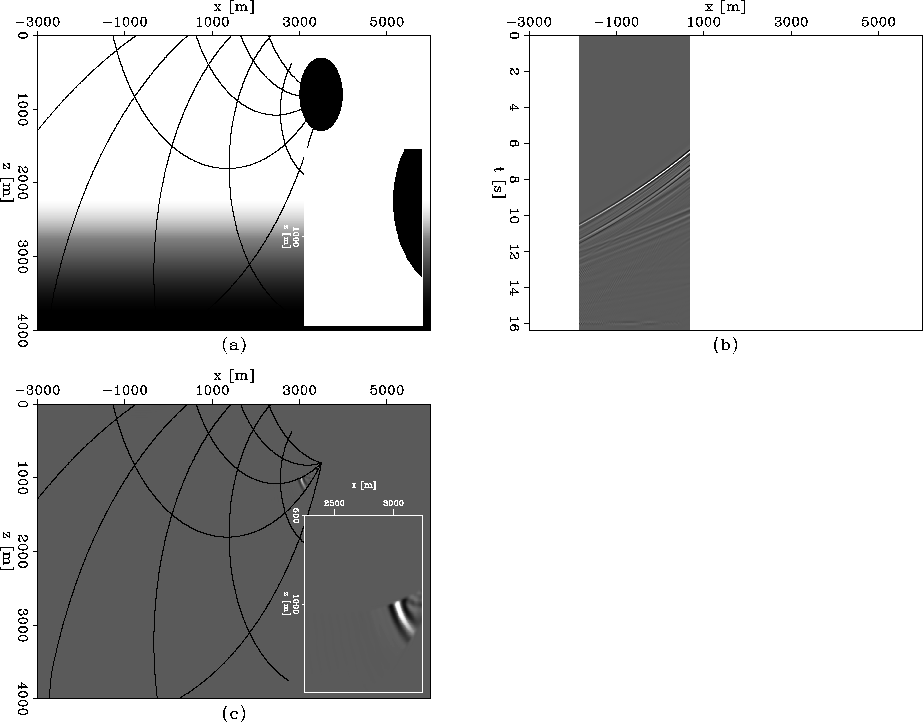
Finally, we present an example of zero-offset migration of overturning reflections using Riemannian wavefield extrapolation. Figure 12 depicts the velocity model (a), the recorded data (b), and the migrated image (c). The overlay is a sketch of the ray coordinate system used for migration. The first event in the data corresponds to the overturning reflection from the ball and is imaged correctly, and the later events are multiple reverberations inside the ball which are not imaged with our method.
 |
![[*]](http://sepwww.stanford.edu/latex2html/movie.gif)