![\begin{eqnarray}
\phi_{\rm min}^{\gamma}
&=&
\phi_{\rm min}^{90} +
\left(
\phi_{...
...)
\left[
\sin
\left(
\frac
{
90-\gamma
}
{
90
}
\right)
\right]^p,\end{eqnarray}](img26.gif)
![\begin{eqnarray}
\phi_{\rm min}^{\gamma}
&=&
\phi_{\rm min}^{90} +
\left(
\phi_{...
...)
\left[
\sin
\left(
\frac
{
90-\gamma
}
{
90
}
\right)
\right]^p,\end{eqnarray}](img26.gif) |
(1) | |
| (2) |
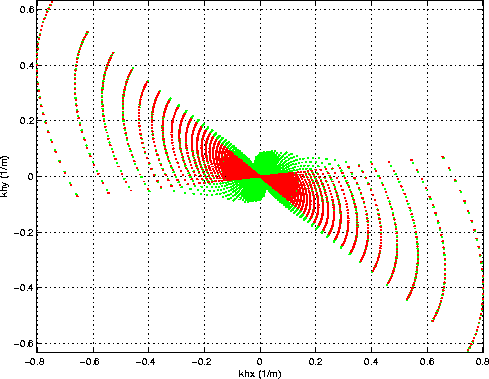
Figure ![[*]](http://sepwww.stanford.edu/latex2html/cross_ref_motif.gif) is a generalization of
Figure
is a generalization of
Figure ![[*]](http://sepwww.stanford.edu/latex2html/cross_ref_motif.gif) .
The red (darker in gray scale) dots are the same as in
Figure
.
The red (darker in gray scale) dots are the same as in
Figure ![[*]](http://sepwww.stanford.edu/latex2html/cross_ref_motif.gif) ,
and represent the mapping into angle domain with
,
and represent the mapping into angle domain with
![]() degrees,
and
degrees,
and
![]() degrees.
The green (lighter in gray scale) is the mapping
when the azimuthal range is broader close to normal incidence,
that is with
degrees.
The green (lighter in gray scale) is the mapping
when the azimuthal range is broader close to normal incidence,
that is with
![]() degrees,
and
degrees,
and
![]() degrees,
and p=3.
Notice that the integration domain represented
by the green dots (lighter in gray scale) does not
shrink close to the origin,
as the original integration domain does.
degrees,
and p=3.
Notice that the integration domain represented
by the green dots (lighter in gray scale) does not
shrink close to the origin,
as the original integration domain does.
Figure ![[*]](http://sepwww.stanford.edu/latex2html/cross_ref_motif.gif) shows the effect of the
variable azimuthal range on the synthetic data set.
Figure
shows the effect of the
variable azimuthal range on the synthetic data set.
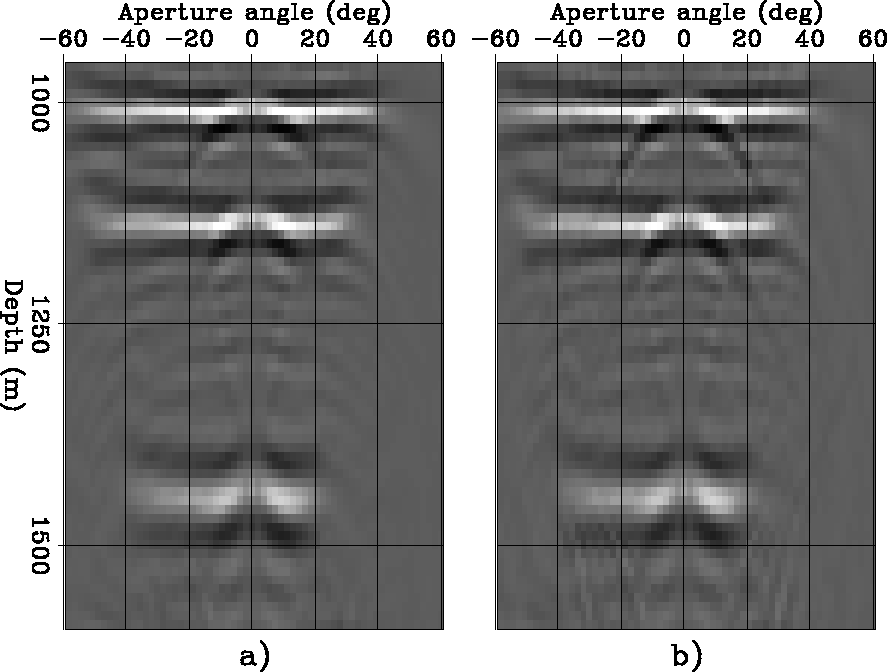
Figure ![[*]](http://sepwww.stanford.edu/latex2html/cross_ref_motif.gif) b shows the same
ADCIG as in
Figure
b shows the same
ADCIG as in
Figure ![[*]](http://sepwww.stanford.edu/latex2html/cross_ref_motif.gif) b.
The azimuthal range was constant over
b.
The azimuthal range was constant over ![]() ;that is
;that is
![]() degrees,
and
degrees,
and
![]() degrees.
Figure
degrees.
Figure ![[*]](http://sepwww.stanford.edu/latex2html/cross_ref_motif.gif) a shows the ADCIG extracted
at the same location as the one in
Figure
a shows the ADCIG extracted
at the same location as the one in
Figure ![[*]](http://sepwww.stanford.edu/latex2html/cross_ref_motif.gif) b,
but
obtained with variable azimuthal range.
The parameters were
b,
but
obtained with variable azimuthal range.
The parameters were
![]() degrees,
degrees,
![]() degrees,
degrees,
![]() degrees,
degrees,
![]() degrees,
and p=3.
The reduction in the azimuthal range attenuates the numerical
noise in the image.
In particular, it attenuates the ``frowning''
artifacts that, as I discussed in the previous section,
are related to the narrow azimuthal coverage of the data.
degrees,
and p=3.
The reduction in the azimuthal range attenuates the numerical
noise in the image.
In particular, it attenuates the ``frowning''
artifacts that, as I discussed in the previous section,
are related to the narrow azimuthal coverage of the data.
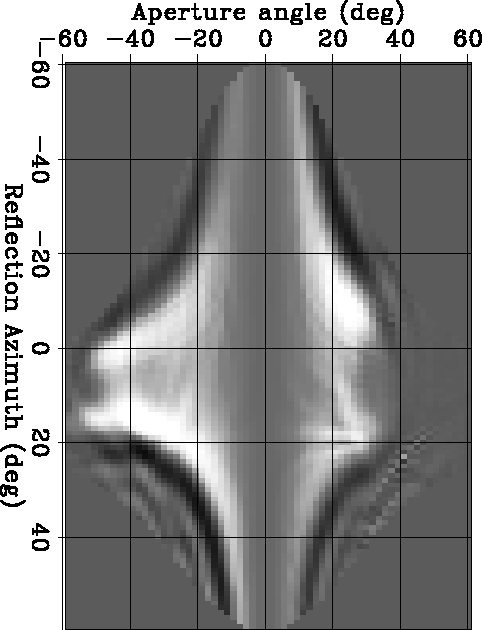
Figure ![[*]](http://sepwww.stanford.edu/latex2html/cross_ref_motif.gif) shows a depth slice extracted from the image at the same depth
as the slices shown in
Figures
shows a depth slice extracted from the image at the same depth
as the slices shown in
Figures ![[*]](http://sepwww.stanford.edu/latex2html/cross_ref_motif.gif) -
-![[*]](http://sepwww.stanford.edu/latex2html/cross_ref_motif.gif) ,
but with the variable azimuthal range defined
by the parameters listed above.
The comparison of
Figure
,
but with the variable azimuthal range defined
by the parameters listed above.
The comparison of
Figure ![[*]](http://sepwww.stanford.edu/latex2html/cross_ref_motif.gif) with
Figure
with
Figure ![[*]](http://sepwww.stanford.edu/latex2html/cross_ref_motif.gif) demonstrates that the window defined using the
relationships (1) and (2)
preserves the
coherent energy of the event,
while removing noise.
demonstrates that the window defined using the
relationships (1) and (2)
preserves the
coherent energy of the event,
while removing noise.
|
kh_plane_wide
Figure 9 Graphical representation of the effects of the variable azimuthal range on the mapping from the offset wavenumber |  |
|
cig-3-data6
Figure 10 ADCIGs for a synthetic data set. Left: Image obtained after application of both the angular dependent weighting and the variable azimuthal range. Right: Image obtained after application of the angular dependent weighting. |  |
|
zaz-60-60-dense-all-jac-bound-v3-data6
Figure 11 Depth slice taken at the same depth as the slice shown in Figure ![[*]](http://sepwww.stanford.edu/latex2html/cross_ref_motif.gif) (z=1,1140 meters),
after application of both the angular dependent weighting
and the variable azimuthal range.
(z=1,1140 meters),
after application of both the angular dependent weighting
and the variable azimuthal range.
|  |