

Next: Spirit River sandstone
Up: EXAMPLES
Previous: Sierra White granite
scvvsq_all2
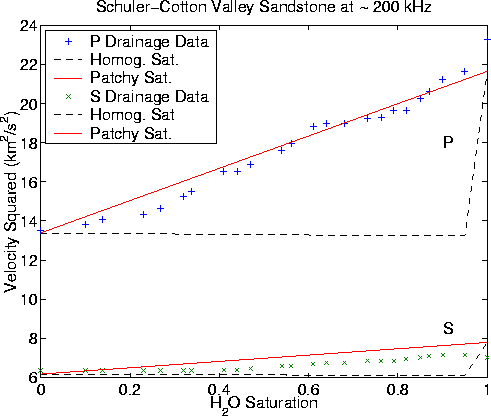
Figure 2
Square of the velocity data for the Schuler-Cotton Valley sandstone
measured by Murphy (1982) at about 200 kHz. The dashed lines are the DEM
results for compressional and shear when it is assumed that the saturation is
homogeneous in each pore. The solid lines are the results for patchy
saturation.
In this case, all the data for compressional waves fall closer to the
patchy saturation line than to the curve for homogeneous saturation.
The data for shear waves seem to be much less sensitive to the assumed
crack aspect ratio than were the compressional wave data. The results
seem to suggest that the cracks that dominate compressional wave
propagation are not the same as the ones dominating shear wave
propagation for this sample.

The data presented here on Schuler-Cotton Valley sandstone are
from Murphy (1982). Walls (1982) also studied permeability variations
of other samples from the same formation, but both of his samples had higher
porosity than the one studied by Murphy ( ). Murphy's
compressional wave measurements were made at about 200 kHz and the
shear measurements at about 150 kHz. The fitting parameters chosen for this
sample were Km = 41.8 GPa,
  GPa, and
  . Otherwise the analysis was identical to that for Sierra White granite.
Results are shown in Figure 3. These curves are similar to those
for the granite since the compressional wave data show a
very clear trend along the patchy saturation line. The shear wave
data were harder to fit for this case, since the change in shear wave
speed does not mimic that of the compressional wave as one might expect.
For the Sierra White granite, a single value of
  was
sufficient to bring both P- and S-wave speeds into good
agreement with the theoretical curves. Here, this was not possible,
as the variation in compressional wave speed is substantially greater
than that for the shear wave speed. A possible conclusion from
this observed behavior is that the cracks that dominate compressional
wave speed changes are not the same as those for the shear wave speed
changes in this rock. But if this is true, it is not clear how
to go about modeling such an effect.


Next: Spirit River sandstone
Up: EXAMPLES
Previous: Sierra White granite
Stanford Exploration Project
11/11/2002
