

Next: Summary of results
Up: EXAMPLES
Previous: Schuler-Cotton Valley sandstone
srsvsq_all2
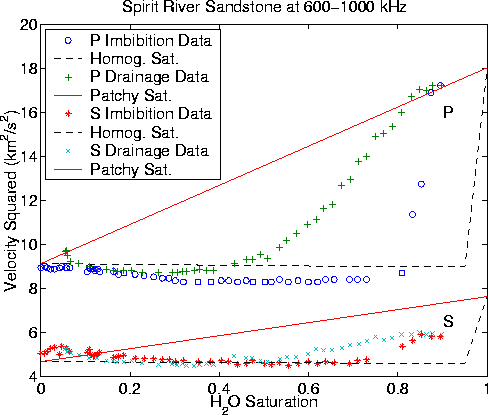
Figure 3
Square of the velocity data for the Spirit River sandstone
measured by Knight and Nolen-Hoeksema (1990) in the range
600-1000 kHz. The dashed lines are the DEM results for compressional
and shear when it is assumed that the saturation is
homogeneous in each pore. The solid lines are the results for patchy
saturation. Imbibition data are expected to fall closer to the
homogeneous saturation curve, which is seen here for both Vp and Vs.
Although the drainage data are expected to fall closer to the patchy
saturation line, this tendency is only observed here at the higher
saturation levels. See discussion in the text.

The acoustical data on Spirit River sandstone are from Knight and
Nolen-Hoeksema (1990). Both Murphy (1982) and Walls (1982) also
studied the Spirit River sandstone, and Walls' sample SR6547 is
apparently the same one studied by Knight and Nolen-Hoeksema.
Imbibition data are expected to fall closer to the
homogeneous saturation curve, which is seen to be true
here for both Vp and Vs.
Although the drainage data are expected to fall closer to the patchy
saturation line, this tendency is only observed here at the higher
saturation levels (> 40 %).
Walls (1982) studied the gas permeability of the Spirit River
sandstone as a function of both saturation and effective pressure.
At room pressure the gas permeability changed from 100  D to 47
  D
as the liquid saturation changed from zero to 40%. Then, as the
effective pressure increased, the permeability of the 40% saturated
sample fell more rapidly than that of the other sample, differing by
an order of magnitude at 30 MPa.
Since the porosity of this sample is about 5%, the volume fraction of
the whole sample occupied by liquid at 40% saturation is about 2%. It is
commonly observed that liquids can begin to percolate (i.e., maintain a
continuous connected pathway) across a porous sample when their volume
fraction is of the order of 2-3%. So we assume that this dramatic
departure of the observed drainage data is in some way related to
this percolation threshold.
T
ABLE 2.Fitting parameters of the three rock samples considered in
the text.


Next: Summary of results
Up: EXAMPLES
Previous: Schuler-Cotton Valley sandstone
Stanford Exploration Project
11/11/2002
