

Next: Schuler-Cotton Valley sandstone
Up: EXAMPLES
Previous: EXAMPLES
swgvsq_all2
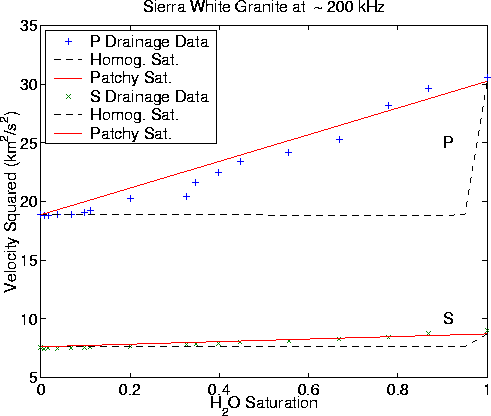
Figure 1
Square of the velocity data for the Sierra White granite
measured by Murphy (1982) at 200 kHz. The dashed lines are the DEM
results for compressional and shear when it is assumed that the saturation is
homogeneous in each pore. The solid lines are the results for patchy
saturation.
Clearly, the data all fall closer to the patchy saturation lines at
the higher values of liquid saturation. For the very lowest values of liquid
saturation, the data seem to mimic the homogeneous saturation curve.

All the data presented here for Sierra White granite are from Murphy
(1982). This case is especially simple as the porosity is quite
low ( ) and therefore the effect of liquid saturation on the
density is very small (
 density effect), which we will treat
for purposes of hand analysis as negligible.
Thus, essentially the entire effect of liquid saturation depends on
how the liquid is distributed in the pores and how this affects the bulk
and shear moduli only. We will model this simply by considering the
effects of gas saturation and liquid saturation separately and then
combining the results [Voigt (1928) average] for the patchy saturation
effects.
For homogeneous saturation, we use DEM with an effective fluid bulk
modulus given by the Reuss (1929) average (harmonic mean) of the
fluids' moduli.
Murphy describes Sierra White as a
granite ``composed of a sparse population of low aspect ratio cracks,
embedded in a composite of elastic grains.'' Some preliminary
calculations done for the present work indicate that an aspect ratio
of  to 0.02 should give results very consistent with the
measured values for Sierra White. To fit the data at both the fully
gas saturated end and the fully water saturated end, we found that
Km = 57.7 GPa and
  GPa were good choices. The
computation was performed at 21 equally spaced values of saturation
for homogeneous saturation. The patchy saturation curve is obtained
by connecting the two end points on a plot of velocity squared
with a straight line. (For situations with significant density
variation, it is preferable to plot the Lamé constants
  and
and  instead of the squares of the velocities -- but for small porosity
this is always a small difference that we choose to ignore here.)
The results are shown in Figure 2.
Clearly, all the data fall closer to the patchy saturation lines at
the higher values of liquid saturation. For the very lowest values of liquid
saturation, the data seem to mimic the homogeneous saturation curve,
but at these low saturation levels the two curves are very close
together anyway.


Next: Schuler-Cotton Valley sandstone
Up: EXAMPLES
Previous: EXAMPLES
Stanford Exploration Project
11/11/2002
