

Next: CONCLUSIONS
Up: Clapp: Ray-based tomography with
Previous: Theory
To test the methodology I applied it on a 2-D North Sea line taken
from a 3-D volume, the same dataset used in Clapp (2000, 2001).
There is a significant 3-D component to the data, especially from
the salt structure.
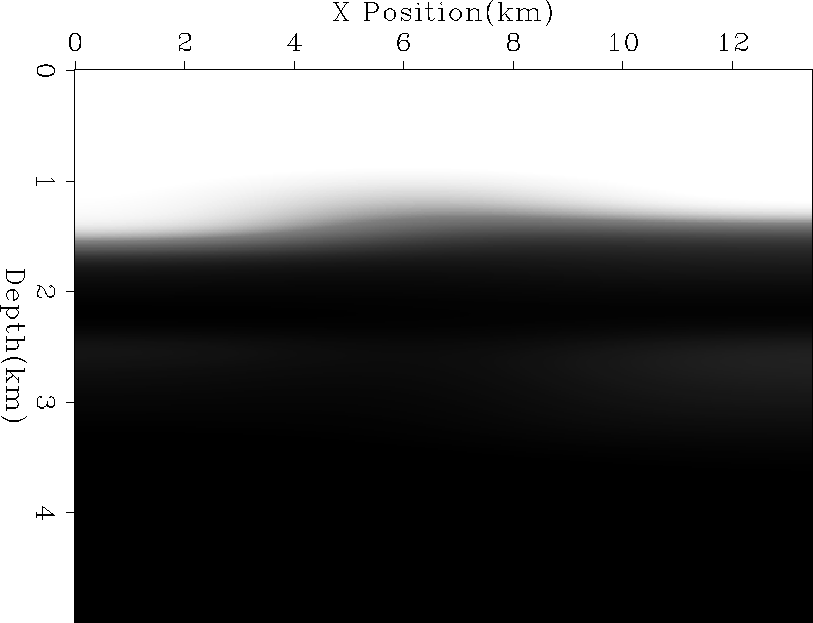
Figure 3 shows the initial velocity model.
The initial velocity model was created by smoothing to an extreme the
S.M.A.R.T![[*]](http://sepwww.stanford.edu/latex2html/foot_motif.gif) method Ehinger and Lailly (1995); Jacobs et al. (1992).
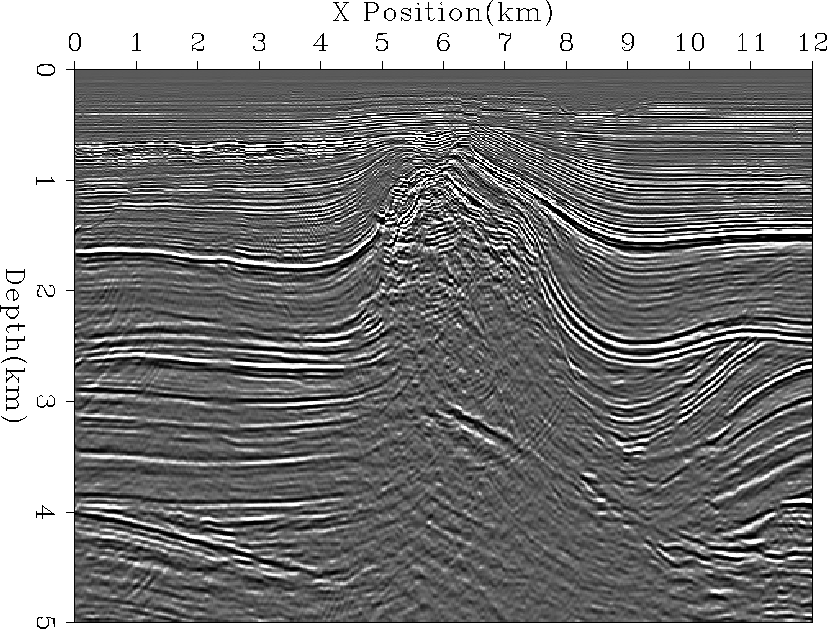
Figure 4 shows the initial migration (by doing split-step
downward continuation) of the data and
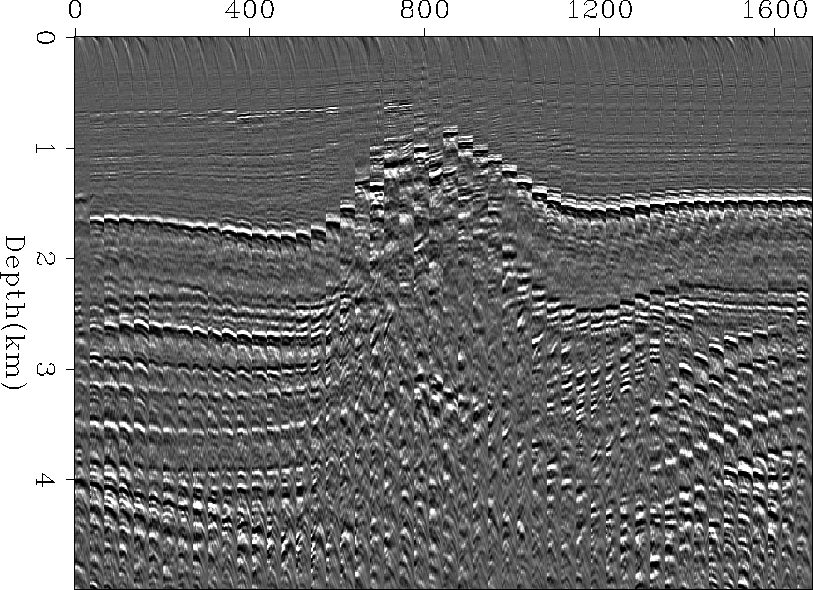
Figure 5 show every 10th CRP gather. Note how there
is significant residual moveout throughout the model.
vel0
method Ehinger and Lailly (1995); Jacobs et al. (1992).
Figure 4 shows the initial migration (by doing split-step
downward continuation) of the data and
Figure 5 show every 10th CRP gather. Note how there
is significant residual moveout throughout the model.
vel0
Figure 3 Initial velocity model.


 image.vel0
Figure 4 Initial migration using the velocity
model shown in Figure 3.


 mig.vel0
Figure 5 Every 10th CRP gather of the initial migration
(Figure 4) using the velocity
model shown in Figure 3.


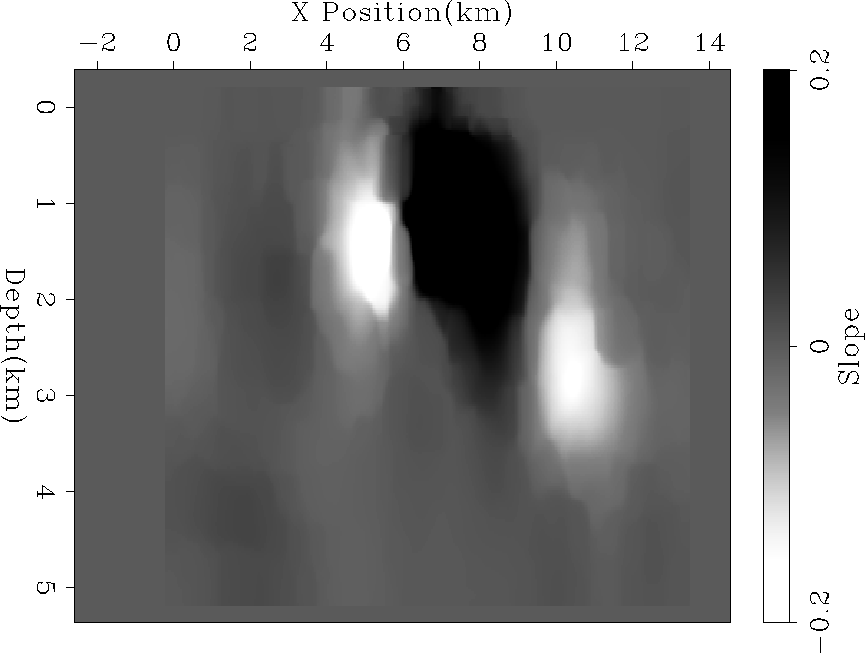
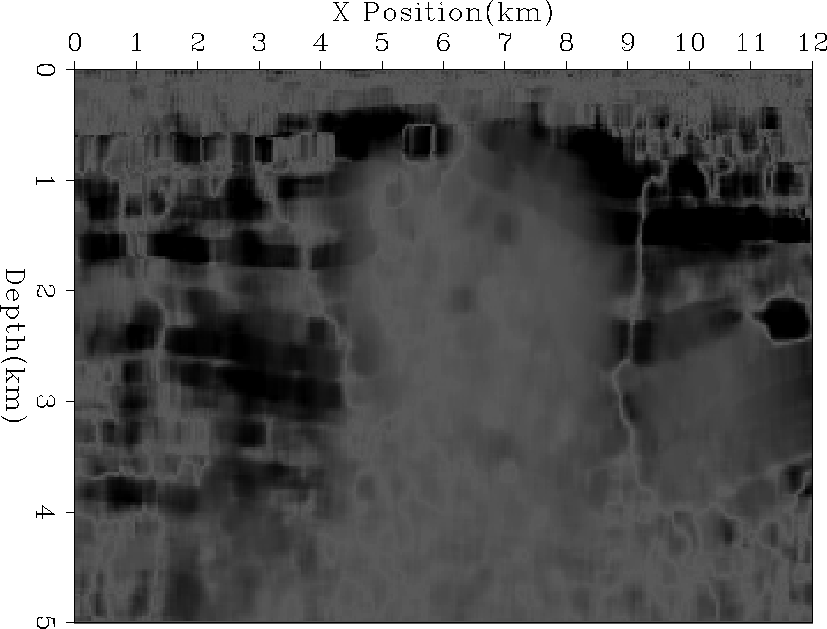
From this initial migrated image I calculated the dip
(Figure 6) and coherence (Figure 7).
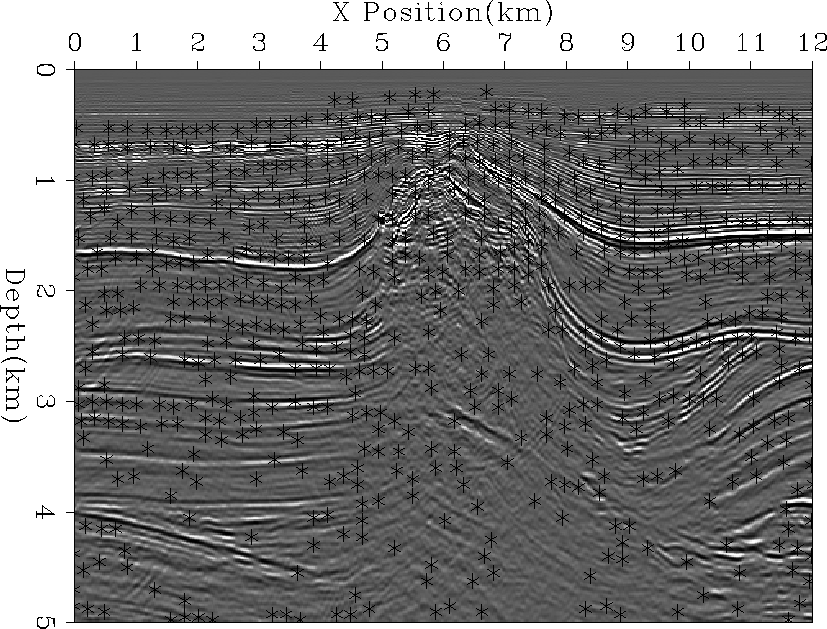
To calculate the initial back projection points I selected points
above 30th percentile in image amplitude, 45th percentile in
dip coherence, and at least four model points away
from all other selected points.
I then calculated semblance at each point and parsed
from the list points with semblance below .16 and whose maximum
was less than 40% below the average semblance.
Figure 8 shows the final location of back projection points.
Note how there are few points near the salt body and in the lower portion
of the image.
dipxz.vel0
Figure 6 The calculated dip field for the initial migration image.
|
|  |


coher.vel0
Figure 7 The calculated dip coherence for the initial migration image.
|
|  |


pts.vel0
Figure 8 The selected back projection points.
Note how the points generally follow reflectors and avoid the salt
structure.
|
|  |


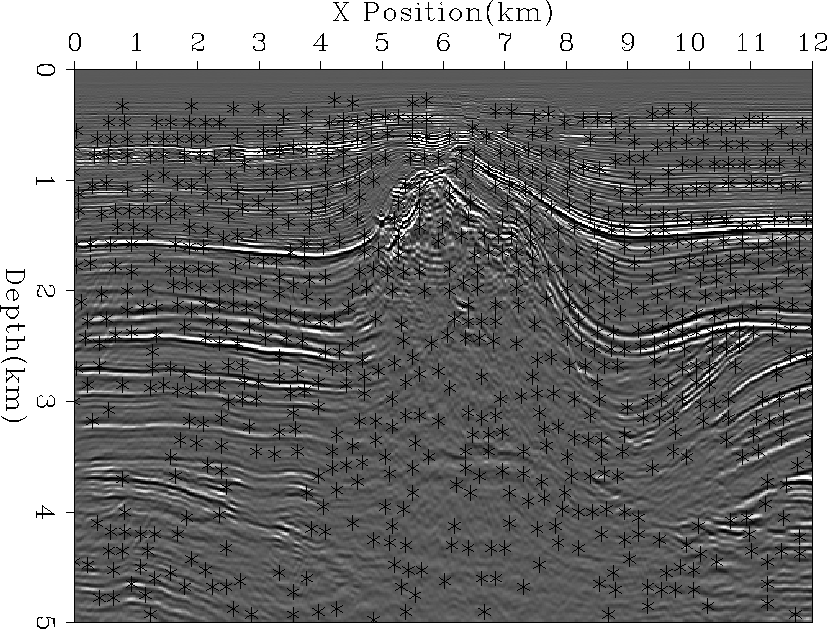
As image quality improves, the automatic selector slowly uses
more and more model points. Figure 9 shows
the points selected after the five iteration of tomography. Note
how there are now many more points in the lower portion of the model
and closer to the salt.
The velocity
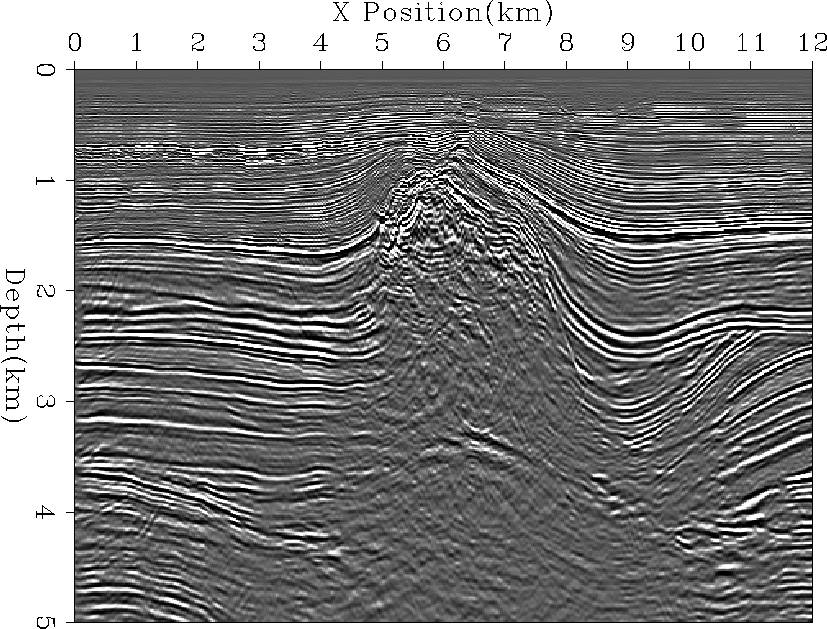
model after five iterations can be seen in Figure 10 and
the resulting migrated image in Figure 11.
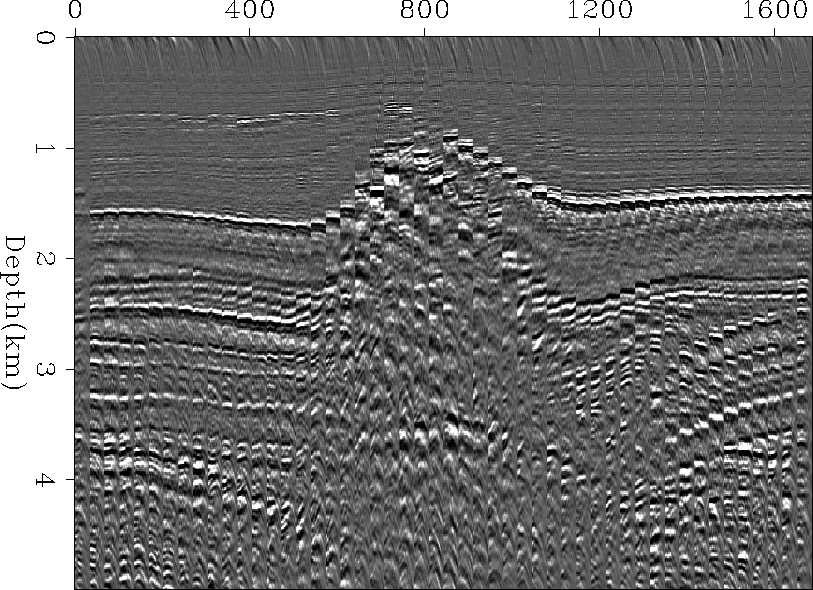
Figure 12 shows the CRP gathers of the fifth
migration. Note how they are significantly
flatter than in Figure 12.
pts.final
Figure 9 The selected back projection points after
five iterations.
Note the difference from Figure 8.
|
|  |


 final
final
Figure 10 Final velocity model.


 image.final
Figure 11 Final migration using the velocity
model shown in Figure 10.


 mig.final
Figure 12 Every 10th CRP gather of the final migration
(Figure 11) using the velocity
model shown in Figure 10.


Next: CONCLUSIONS
Up: Clapp: Ray-based tomography with
Previous: Theory
Stanford Exploration Project
9/18/2001
![[*]](http://sepwww.stanford.edu/latex2html/foot_motif.gif) method Ehinger and Lailly (1995); Jacobs et al. (1992).
Figure 4 shows the initial migration (by doing split-step
downward continuation) of the data and
Figure 5 show every 10th CRP gather. Note how there
is significant residual moveout throughout the model.
method Ehinger and Lailly (1995); Jacobs et al. (1992).
Figure 4 shows the initial migration (by doing split-step
downward continuation) of the data and
Figure 5 show every 10th CRP gather. Note how there
is significant residual moveout throughout the model.

