|
old
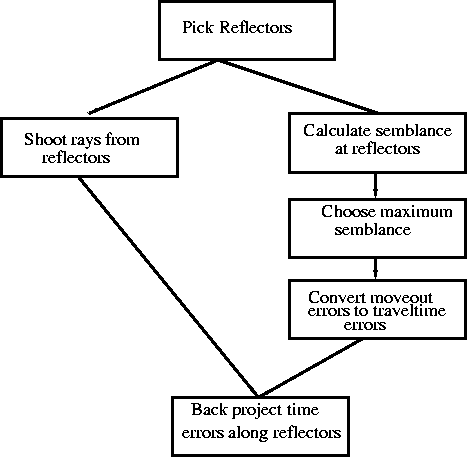
Figure 1 A typical ray-based reflection tomography loop. |  |
Figure 1 shows the typical flow for ray-based reflection tomography.
|
old
Figure 1 A typical ray-based reflection tomography loop. |  |
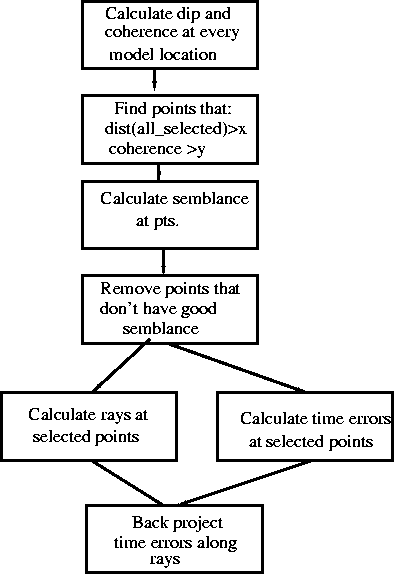
Figure 2 shows an alternate ray-based tomography flow. Rather than using picked reflectors as the basis for back projection locations, points are selected according to reliability factors. First dip and coherency of the migrated image is calculated at each image location. For an initial dip and coherence estimate I take a window around each model location. I calculate the best single dip within the region, and the coherence of that dip, using the method described in Claerbout (1992). I then use this as an initial dip estimate for the non-linear, space varying dip estimation procedure described in Fomel (2000).
|
new
Figure 2 Back-projection scheme used in this paper. Note the absence of reflector picking. |  |
Likely back projection points are then automatically selected by finding model locations that meet some specified dip coherence, amplitude, and distance from other selected points. To get the `best' points in each region, these criteria are slowly relaxed (e.g. the first pass might look for points above the 90th percentile in amplitude and dip coherence, while the last pass might drop both these criteria to the 50th percentile.).
At each initially selected point semblance analysis is performed. Points that don't have good semblance (large semblance value and a definite maximum) are discarded. The remaining points are then used.