 |
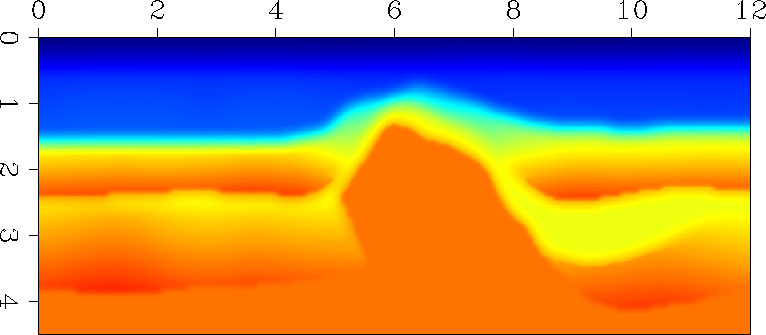
Figure 4 Velocity map for the North Sea dataset.
![[*]](http://sepwww.stanford.edu/latex2html/cross_ref_motif.gif) is the velocity map used to compute the background
wavefield, and Figure
is the velocity map used to compute the background
wavefield, and Figure ![[*]](http://sepwww.stanford.edu/latex2html/cross_ref_motif.gif) is the image obtained after split-step
migration with the background slowness model using three reference velocities.
is the image obtained after split-step
migration with the background slowness model using three reference velocities.
The image is extracted from common-image gathers at a selected value of the offset ray-parameter Prucha et al. (1999), which is approximately equivalent to the image for a given incidence angle at the reflectors Sava and Fomel (2000). As expected, the geologic structure is not perfectly defined by one single incidence angle, although this is not a problem for these examples, since I use the image at a given incidence angle only to create the image perturbation, but use the entire prestack image as background during backprojection.
 |
 |
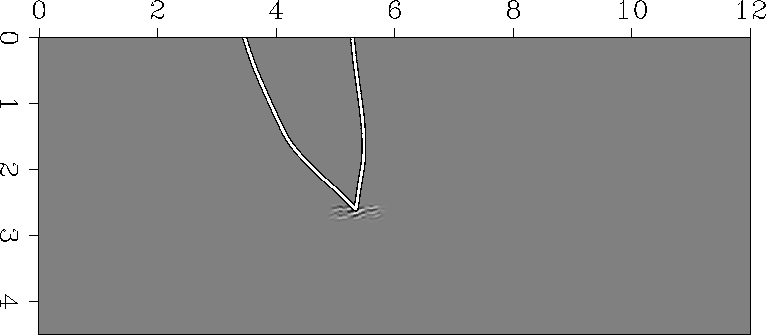
Figure ![[*]](http://sepwww.stanford.edu/latex2html/cross_ref_motif.gif) is a simulated image perturbation (
is a simulated image perturbation (![]() ) localized
under the salt flank. I create this perturbation by cutting a small window
in the target region, shifting it down so that the phase difference between
the two images doesn't violate the Born approximation, and taking the
difference.
) localized
under the salt flank. I create this perturbation by cutting a small window
in the target region, shifting it down so that the phase difference between
the two images doesn't violate the Born approximation, and taking the
difference.
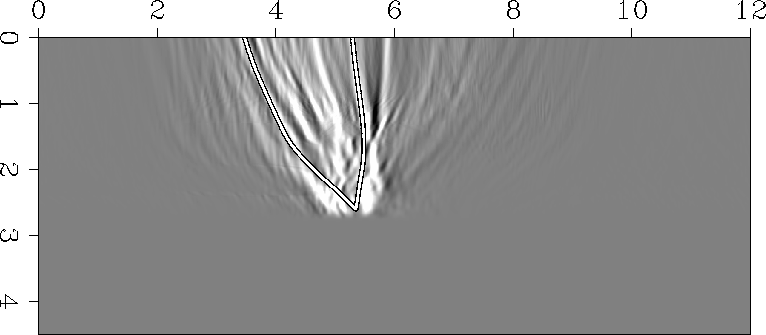
Next, Figure ![[*]](http://sepwww.stanford.edu/latex2html/cross_ref_motif.gif) is the result of applying the backprojection
operator in Equation (17) to the image perturbation in Figure
is the result of applying the backprojection
operator in Equation (17) to the image perturbation in Figure ![[*]](http://sepwww.stanford.edu/latex2html/cross_ref_motif.gif) .
The backprojection operator turns the image perturbation into a bundle of
``fat'' rays (
.
The backprojection operator turns the image perturbation into a bundle of
``fat'' rays (![]() ) emerging from the region of perturbation. The rays follow
various trajectories, in accordance to the velocity model and with the
background image.
) emerging from the region of perturbation. The rays follow
various trajectories, in accordance to the velocity model and with the
background image.
 |
 |
![[*]](http://sepwww.stanford.edu/latex2html/cross_ref_motif.gif) . Overlaid are a pair of
specular rays.
. Overlaid are a pair of
specular rays.
For comparison, I superimpose on both images in Figures ![[*]](http://sepwww.stanford.edu/latex2html/cross_ref_motif.gif) and
and
![[*]](http://sepwww.stanford.edu/latex2html/cross_ref_motif.gif) a pair of specular rays, shot at roughly the same angle with
respect to the normal to a hypothetical reflector in the perturbation region
as the angle given by the offset ray parameter at which I selected the image
perturbation. The rays overlap well over one pair of ``fat'' rays. In fact,
these images graphically illustrate the band-limited
character of wave-equation migration velocity analysis, which is its most
important property.
a pair of specular rays, shot at roughly the same angle with
respect to the normal to a hypothetical reflector in the perturbation region
as the angle given by the offset ray parameter at which I selected the image
perturbation. The rays overlap well over one pair of ``fat'' rays. In fact,
these images graphically illustrate the band-limited
character of wave-equation migration velocity analysis, which is its most
important property.
 |
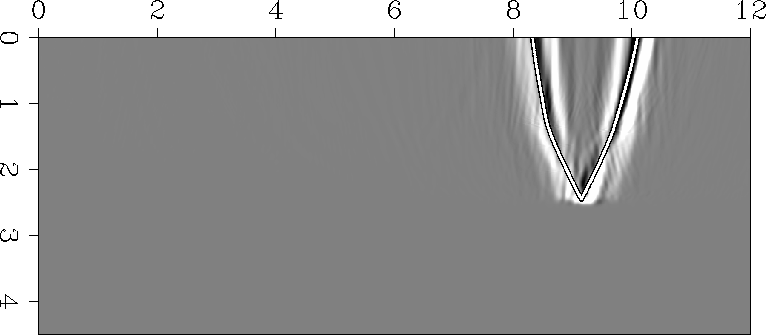 |
![[*]](http://sepwww.stanford.edu/latex2html/cross_ref_motif.gif) . Overlaid are a pair of
specular rays.
. Overlaid are a pair of
specular rays.
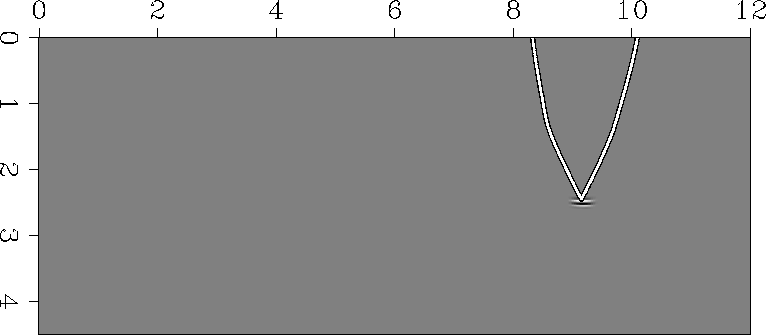
The backprojection in Figure ![[*]](http://sepwww.stanford.edu/latex2html/cross_ref_motif.gif) corresponds to just a particular
selection of the incidence angle at the reflector. Perturbations at other angles
backproject over other regions of the slowness model. When all backprojections
are put together, we obtain a smoother version of slowness perturbation in
comparison to that obtained using ray tomography Sava and Biondi (2000).
Ray tomography requires a significant amount of model regularization
Clapp and Biondi (1999) to control the shape of the inverted model.
However, given its intrinsic band-limited nature, wave-equation migration velocity
analysis requires less regularization, or model-styling, applied on the slowness model.
The net result is that we need less a-priori information about our slowness model,
and we can extract more information from our data.
corresponds to just a particular
selection of the incidence angle at the reflector. Perturbations at other angles
backproject over other regions of the slowness model. When all backprojections
are put together, we obtain a smoother version of slowness perturbation in
comparison to that obtained using ray tomography Sava and Biondi (2000).
Ray tomography requires a significant amount of model regularization
Clapp and Biondi (1999) to control the shape of the inverted model.
However, given its intrinsic band-limited nature, wave-equation migration velocity
analysis requires less regularization, or model-styling, applied on the slowness model.
The net result is that we need less a-priori information about our slowness model,
and we can extract more information from our data.
Unlike in the first example, Figures ![[*]](http://sepwww.stanford.edu/latex2html/cross_ref_motif.gif) and
and ![[*]](http://sepwww.stanford.edu/latex2html/cross_ref_motif.gif) ,
where part of the wavefield propagates through the salt and, therefore, some of
the fat rays get significantly distorted, in a second example the wavefield
propagates through a much simpler part of the velocity model, and so the fat
rays are less distorted (Figures
,
where part of the wavefield propagates through the salt and, therefore, some of
the fat rays get significantly distorted, in a second example the wavefield
propagates through a much simpler part of the velocity model, and so the fat
rays are less distorted (Figures ![[*]](http://sepwww.stanford.edu/latex2html/cross_ref_motif.gif) and
and ![[*]](http://sepwww.stanford.edu/latex2html/cross_ref_motif.gif) ).
).
As pointed out by Sava and Biondi (2000), the Born approximation is the biggest limitation of the method, since stability requires us to ensure that we do not violate the small-perturbation assumption. Also, the frequency content of the images is not the same, therefore we can obey the Born approximation in some regions, but violate it in others. Better ways to control the Born approximation await for future research.