

Next: Overburden effect
Up: AVO inversion
Previous: AVO inversion
Illustrating the effect of the modeling in the amplitudes,
Figure 6 shows the picked amplitudes (without
any calibration) corresponding to a 2-layer modeling case (no overburden).
Comparing this figure with Figure 5, we can see a very good
qualitative agreement between the relative amplitudes of the different
interfaces (shale/brine, shale/oil, and shale/tuff) and the corresponding
reflection coefficients.
We can see some difference for incident angles
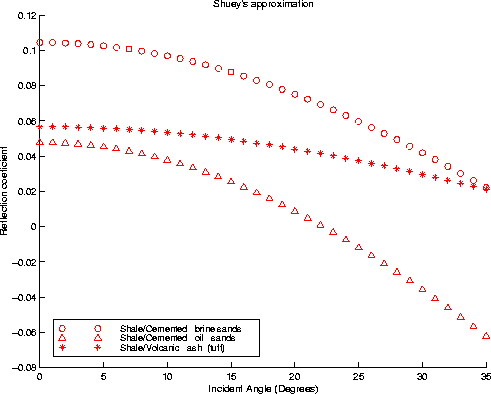
> 25 degrees; for this reason, and because Shuey's approximation is
valid for incident angles < 30 degrees (see Figure 7),
we will restrict the data to be used for the AVO inversion up to 25 degrees
of incident angle.
We can also notice that Zoeppritz equation predicts a
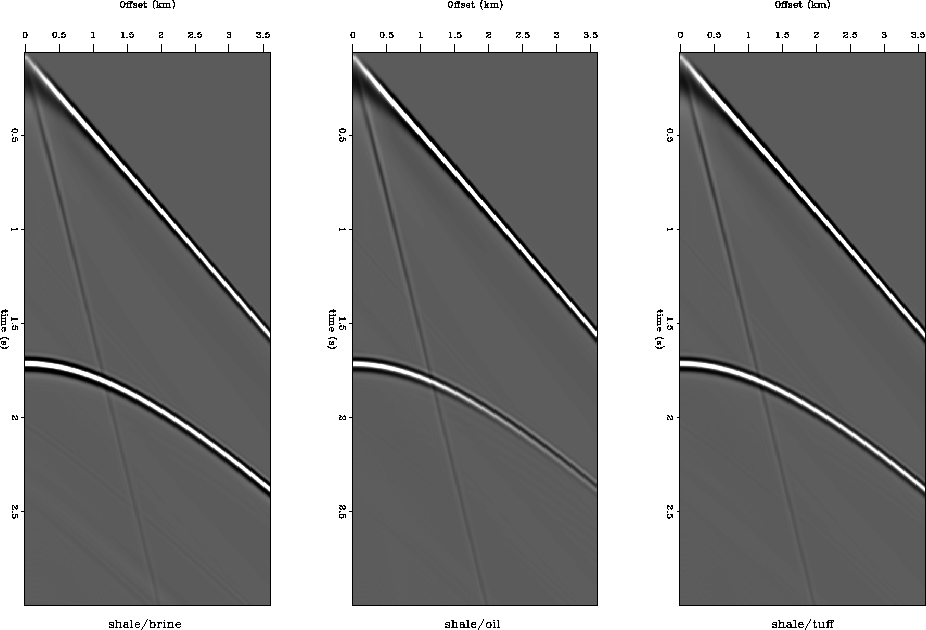
polarity change for the shale/oil case. We observed the same polarity change
in the data (see Figure 8); however, this is not
present in the picked amplitudes because we are using an automated picking
program that picks the maximum absolute value in a moving window in time.
We consider the automatic picking still valid in this modeling case
because the polarity change is evident in the data after offset > 2 km, which
corresponds to angles > 27 degrees,
and we used angles up to 25 degrees for the AVO inversion.
We did not use the automatic picking on migrated data, where the events
are supposed to be flattened by the migration; rather, in this case, we
followed the constant time corresponding to the event.
shuey
Figure 7 Shuey's approximation of P-wave
reflection coefficient
|
|  |


 2lay_all
Figure 8 Modeling of shot gather for a
shale/brine, shale/oil, and shale/tuff interfaces (1-D, 2-layer model).
Notice the change in polarity for offset > 2 km in the shale/oil case


Next: Overburden effect
Up: AVO inversion
Previous: AVO inversion
Stanford Exploration Project
4/28/2000


