

Next: More about IRLS
Up: comparing IRLS and Huber
Previous: Tests on real data
In this section I compare the convergence of the two solvers. Because
the weighting matrix  is recomputed after a certain number of iterations,
the IRLS algorithm consists of a series of different inverse problems. In this case, it may
be unrealistic to compare the convergence of the Huber solver with IRLS. Nonetheless, because the final model
should be nearly identical for both methods (assuming that they converge to same solution), the
comparison appears to be fair. Note that for the IRLS algorithm, the residual is computed using
equation 4.
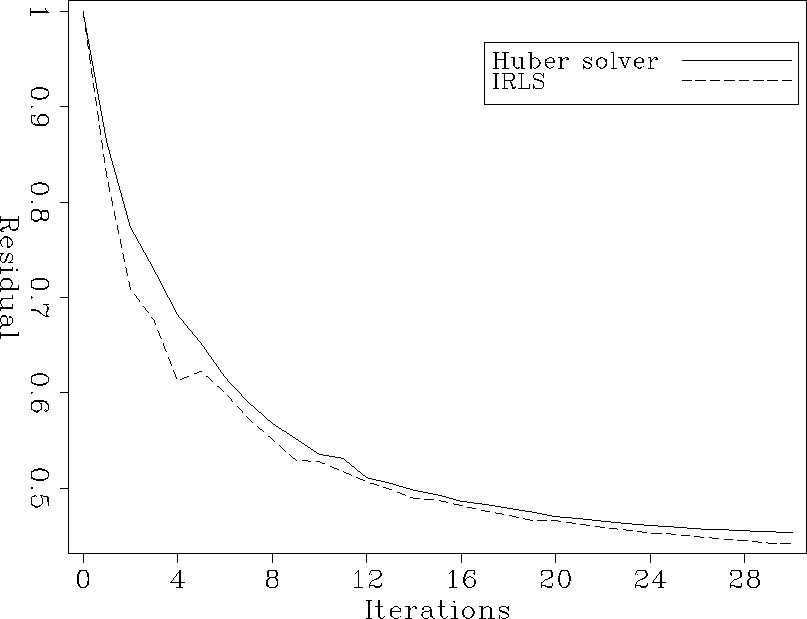
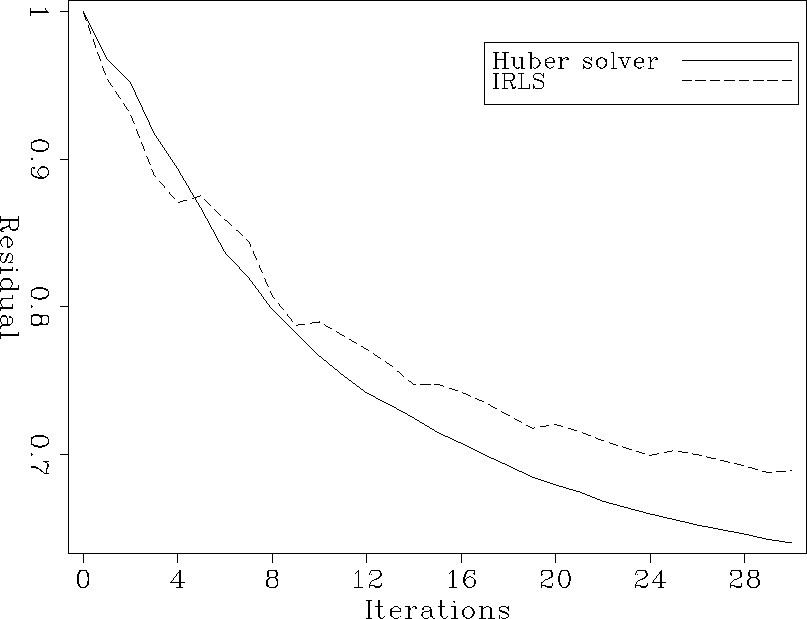
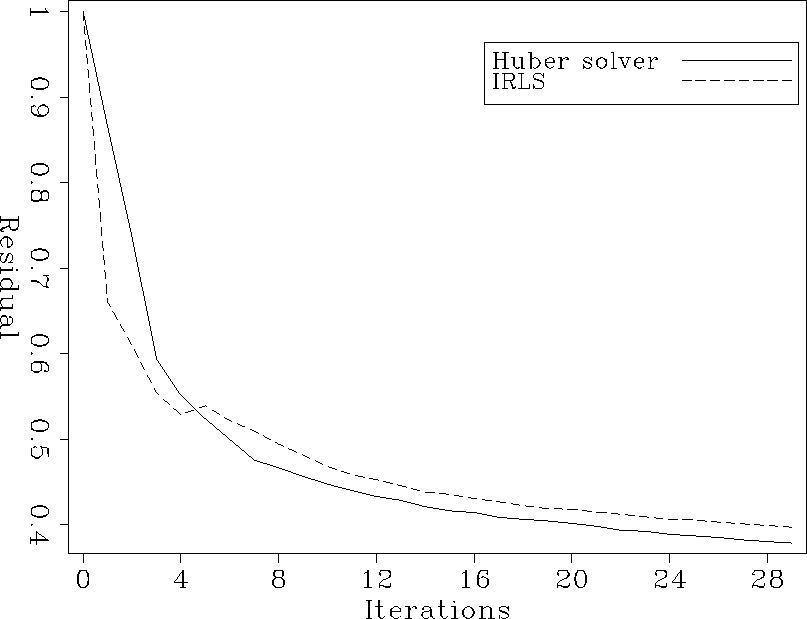
Figures 11, 12 and 13 show respectively
the convergence of the two inversion schemes for the spiky data, the data
with groundroll, and the real data. Except for the spiky data (Figure 11),
the Huber solver converges better than the IRLS scheme.
Note that small jumps in the residual of the IRLS algorithm usually
appear when the weighting matrix
  is recomputed.
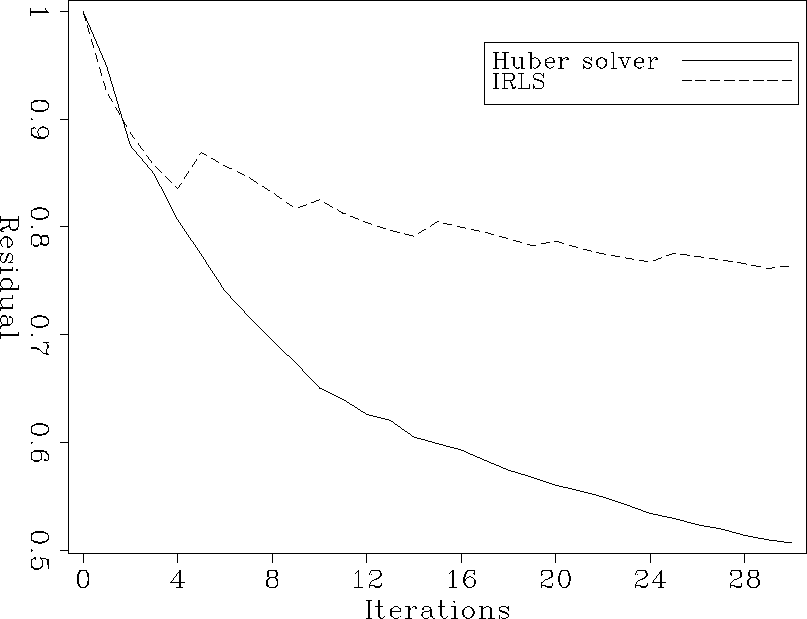
Figures 14 and 15 display the convergence of the inverse problem
with the spiky data for different thresholds. A thorough comparison with Figure 11
(which corresponds to the ``optimal'' threshold given by Darche (1989)) proves that the convergence
is rather sensitive to this parameter: a bigger threshold (Figure 15) leads to
better convergence, whereas a smaller value decreases it. In both cases, the Huber solver converges
significantly better.
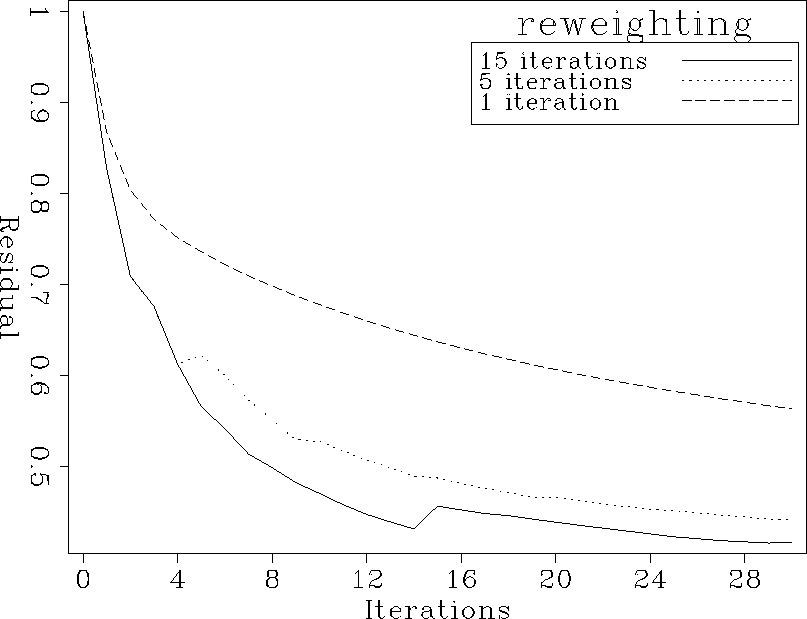
Last, Figure 16 displays the convergence of the IRLS algorithm for different
restart paramaters: the weighting matrix is recomputed after every iteration (steepest
descent), after every five and after every 15 iterations. Recomputing the weight after fifteen
iterations increases the convergence, but only slightly. As expected, recomputing the
weight after every iteration considerably slows down the convergence.
r-spiky-0.04
Figure 11 Relative residuals, spiky data


 r-freq30
Figure 12 Relative residuals, groundroll data


 r-wz08-0.082
Figure 13 Relative residuals, real data


 r-spiky-0.001
Figure 14 Relative residuals, spiky data: 


 r-spiky-4
Figure 15 Relative residuals, spiky data: 


 cIRLSrt
Figure 16 IRLS convergence for different restarts


Next: More about IRLS
Up: comparing IRLS and Huber
Previous: Tests on real data
Stanford Exploration Project
4/27/2000
