

Next: Methodology
Up: Brown & Clapp: Seismic
Previous: Brown & Clapp: Seismic
Loosely defined, the process of stratigraphic interpretation is the analysis of the dip
distribution (or dip spectrum) of a seismic image in small neighborhoods and the
corresponding association of local geology with a given stratigraphic sequence.
The interpreter's job, illustrated in Figure 1, is both tedious and
time-consuming if performed manually, considering the large size of modern 3-D surveys.
For instance, if a given sedimentary unit is best defined by its relative distance from
a pervasive geologic unconformity, the interpreter must first identify the location
of the unconformity over the entire seismic volume.
algorithm
Figure 1 Stratigraphic interpretation: Given a facies template
(left), search a seismic image locally (center) for likely matches to the template, then
output (right) an attribute which illustrates some measure of local similarity
between the template and the seismic image.

To make the stratigraphic interpretation of large 3-D image volumes feasible, an automatic
approach is required to search an image locally for the likely presence of a predefined
ordered pattern, or facies template.
Randen et al. (1998) presented an automated scheme which analyzes local dip spectra to
detect reflector terminations in seismic images, and hint that such an approach could be used
to detect unconformities and recognize facies patterns.
Neural networks have been applied to this end, but the results are often non-intuitive.
We present a scheme which automatically searches a seismic image for an arbitrary facies
template, and then outputs a similarity attribute which expresses the data's relative
local resemblance to the template.
To compute the similarity attribute, we recast this problem of pattern recognition to one of
signal/noise separation, i.e., treating the facies template as the ``noise model'', we
seek to remove an optimal amount of it from small data windows, then define the attribute
as the local noise-to-signal ratio.
It follows that the similarity attribute is both physically meaningful and optimal in one
(least squares) sense.
We first test the scheme on a 2-D synthetic seismic image with two unconformities, and find
that both are detected reliably. We then perform the same test on a 2-D real seismic
image, and successfully detect an unconformity.
The performance of the scheme is encouraging, and there is considerable room for
optimization.
algorithm2
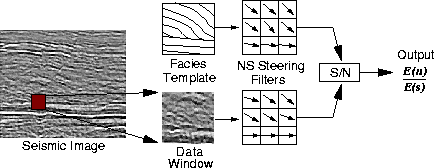
Figure 2 For each output point, extract a neighboring
window of data the same size as the facies template. Capture the local dip spectra of the
facies template and data window with simple nonstationary ``steering filters''.
Treating the facies template as the ``noise'' model, apply a predictive signal/noise
separation technique to extract energy from the data window where the local dip coincides
with that of the template. The output, simply the noise-to-signal ratio, is then a valid
measure of local similarity.


Next: Methodology
Up: Brown & Clapp: Seismic
Previous: Brown & Clapp: Seismic
Stanford Exploration Project
10/25/1999

