

Next: Conclusion
Up: Vaillant & Sava: Common-azimuth
Previous: Common-azimuth imaging results
The velocity model we used for the migration was obtained by reflection
tomography using the
S.M.A.R.T![[*]](http://sepwww.stanford.edu/latex2html/foot_motif.gif) method Ehinger and Lailly (1995); Jacobs et al. (1992). We smoothed
their result before running the common-azimuth migration. Our
smoothing scheme preserved the exact shape of the
salt body to avoid high velocity spreading into the surrounding model,
which would degrade imaging.
method Ehinger and Lailly (1995); Jacobs et al. (1992). We smoothed
their result before running the common-azimuth migration. Our
smoothing scheme preserved the exact shape of the
salt body to avoid high velocity spreading into the surrounding model,
which would degrade imaging.
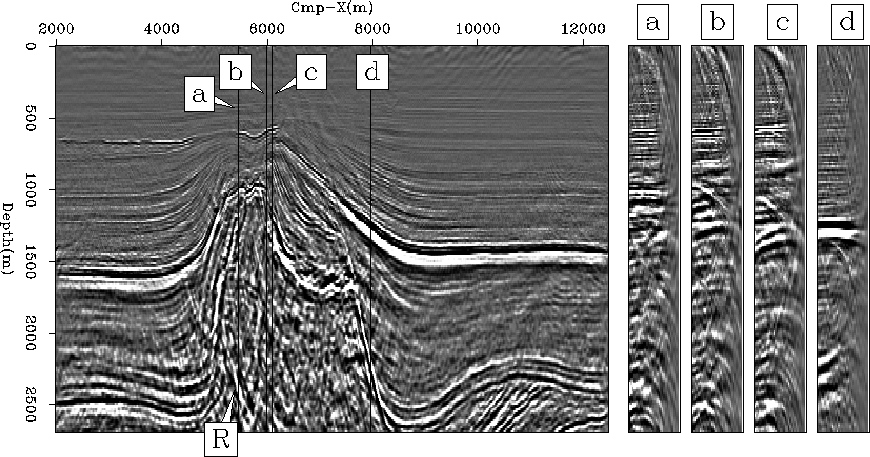
Figure 6 shows common-image gathers along
our main in-line section, illustrating details of the salt
boundaries. When searching for these boundaries on the left-hand side, the
event marked ``R'' seems relatively coherent compared to the
ratio of noise that can be observed inside the salt. It may
reasonably correspond to the salt flank we hope to image on the
left-hand side. The event could as well be an internal multiple
created by reflections on Tertiary/chalk or chalk/salt
interfaces around event ``I''. Additionally, Ogilvie and Purnell
1996 show how converted waves can also create
spurious events sufficiently high in amplitude to confound interpretation.
If ``R'' is effectively the salt
flank, its location after migration remains inaccurate,
since we would expect it to be immediately against the reflectors
bending upwards in the chalk. This event possibly comes from a wavefield
seriously distorted while traveling through the salt body and
recorded at large Cmp-X locations. In contrast, the salt boundary
closer to the top is better migrated since the waves have not propagated
through the dome and have instead been recorded at small Cmp-X locations.
Panel (a) illustrates this hypothesis, showing flat gathers for the
top of the salt edge and, below, reflectors bending upwards with angle
around reflector ``R''.
Furthermore, panels (b) and (c) intersect an area where the
continuity of the salt top is broken. At this particular location, the
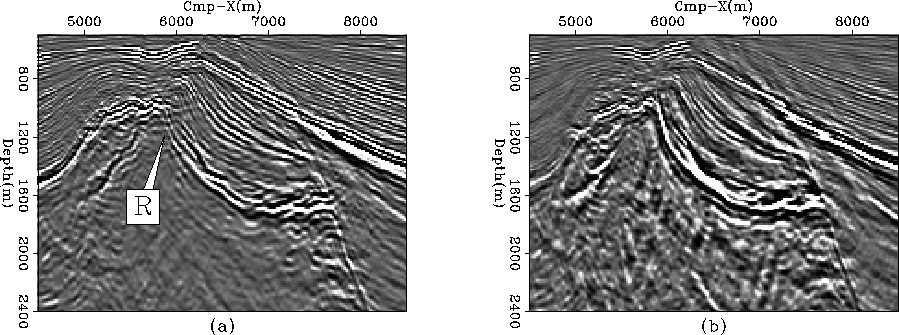
zero-offset migration, being less
sensitive to velocity variations, yields more continuous imaging
(Figure 7). The common-image gathers show
reflectors bending upwards, indicating a too low velocity. Similarly,
on the right-hand side, the salt flank shows a too low velocity (panel
(d)).
L7d-ang-ysect1-set2
Figure 6 In-line
near-angle section at location Cmp-Y=3400m with angle-domain
common-image gathers


 L7d-salt-ComAz-and-ZOmig
Figure 7 Close-up of the salt dome
for the common-azimuth migrated image (a) and the section migrated
with zero-offset extended split-step algorithm (b). ``R'' points out
the reflector of interest. The clip percentile is the same on both
images (96).


We can see from the analysis of common-image gathers that the
velocity model obviously needs further improvements.
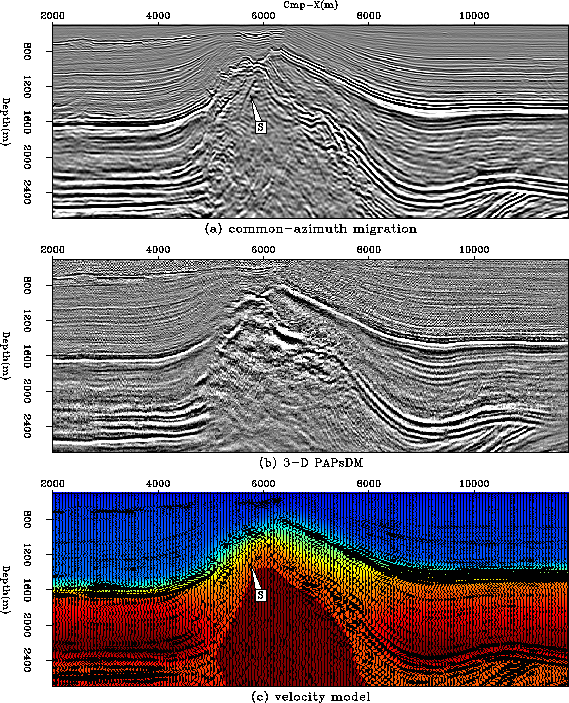
Figure 4 shows the salt
boundaries in the migrated section superimposed on the velocity model
we used for imaging. Performing accurate imaging, especially deeper in
the model, requires a more precise relocation of the major
reflectors, such as the salt edges, with respect to the velocity model.
For this purpose, the information provided by the common-image gathers
can be reinvested in a residual migration process
to improve the focusing of the migrated sections. The next step, which
is less straightforward, is
to update the velocity model from the perturbation between the
starting and the improved images
Biondi and Sava (1999). This remains an open research subject.
Last, we compare the result of 3-D prestack common-azimuth
migration with the 3-D prestack preserved-amplitude
depth migration (PAPsDM) result, courtesy of the Ecole des Mines de
Paris Xu et al. (1999). Figure 8 shows
both results, which are derived from the same velocity model.
However, their implementation of the ray+Born formalism
Thierry et al. (1999a,b) for elaborating the PAPsDM algorithm
yields an image in impedance perturbation rather than in reflectivity
(as in the case of 3-D prestack
common-azimuth migration). In order to
make the migrated images more comparable, we differentiated their
result along the depth axis. Although this conserves the shapes of
the reflectors, the conversion to reflectivity implies (in theory) differenting
perpendicularly to the reflectors, which is not straightforward.
Both sections (a) and (b) in figure 8
display many similarities. The sides of the salt body seem
accurately imaged in both cases, especially on the left-hand side where
the chalk layer bends upwards. However, common-azimuth migration
produces a result significantly more accurate for the top of salt
and for the complex lithologic interfaces in that area. Moreover, the reflector
marked ``S'', which may correspond to the salt boundary, is not
visible in the PAPsDM image. The PAPsDM migrated section could
probably be improved by using a larger offset range in the cross-line
direction (700m here). Interestingly enough, handling multiple
arrivals does not yield a significantly better image, since the result
of 3-D PAPsDM with, respectively, first, strongest, and multiple arrival
are similar at 97% (Gilles Lambaré, personal communication).
L7d-ComAz-vs-PAPsDM
Figure 8 Comparison between the sections
at Cmp-X=4100m migrated using 3-D prestack common-azimuth migration
(a) and 3-D PAPsDM (b). The third section (c) shows the common-azimuth
migrated image superimposed on the velocity model. The PAPsDM result
is courtesy of the Ecole des Mines de Paris.


Next: Conclusion
Up: Vaillant & Sava: Common-azimuth
Previous: Common-azimuth imaging results
Stanford Exploration Project
10/25/1999
![[*]](http://sepwww.stanford.edu/latex2html/foot_motif.gif) method Ehinger and Lailly (1995); Jacobs et al. (1992). We smoothed
their result before running the common-azimuth migration. Our
smoothing scheme preserved the exact shape of the
salt body to avoid high velocity spreading into the surrounding model,
which would degrade imaging.
method Ehinger and Lailly (1995); Jacobs et al. (1992). We smoothed
their result before running the common-azimuth migration. Our
smoothing scheme preserved the exact shape of the
salt body to avoid high velocity spreading into the surrounding model,
which would degrade imaging.


