

Next: Large problem results
Up: SPLIT-STEP MIGRATION
Previous: SPLIT-STEP MIGRATION
First, we analyze the results for the small problem.
We display the results as relative speeds normalized
by the speed achieved on one CPU of the Power Challenge
by the program using the public domain FFT library;
that is, the slowest possible run.
The relative speeds are computed from elapsed time
measured on systems as empty as possible.
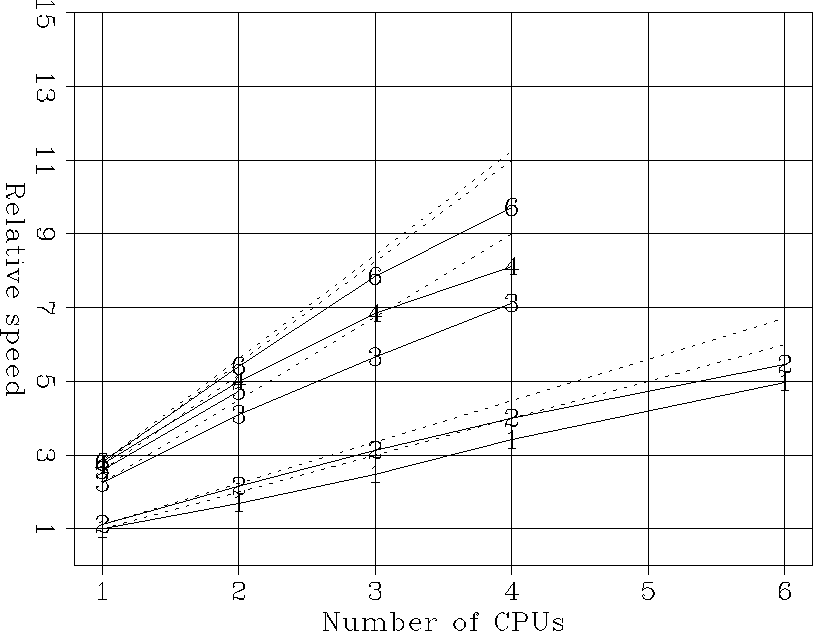
Figure 1
shows these relative speeds for all the computations
performed to solve the small problem,
excluded one-time initializations.
The measured speed are plotted with solid lines,
while the dashed lines correspond to the ideal parallel
speed up for each program.
As expected,
the slowest runs were on the Power Challenge
(lines labeled 1 and 2),
that is also the oldest among the computers we tested.
The four-processor Xeon (line 6) is the fastest of all computers,
running even faster than the O200 with native FFTs (line 4).
The dual-processor Pentium III (line 5) runs slightly
slower than the Xeon,
likely because of the slower I/O.
The parallel speed-up for all cases is reasonable,
though for such small problem the serial I/Os handicap
the parallel runs.
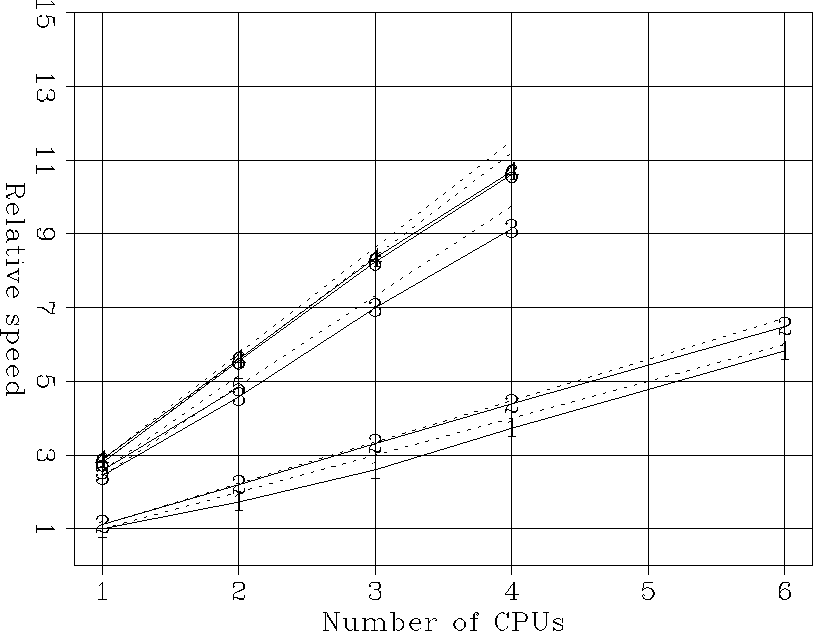
Figure 2
shows the relative speeds for the whole parallel portion of the code.
A good parallel speed-up is achieved
in all cases,
indicating that when the problem fits in cache
there is no degradation of performances
caused by contentions between threads in accessing memory.
The dual-processor Pentium III runs about 10% slower
than the Xeon, and shows slightly worse parallel speed-up.
Since the CPU run at the same speed,
this difference can be attributed to the smaller and slower
secondary cache.
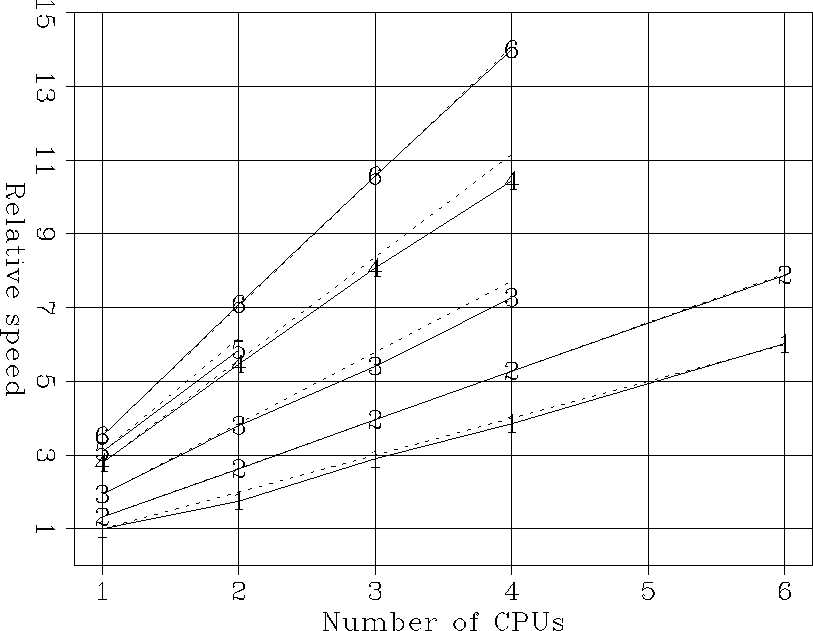
Figure 3
shows the relative speeds for the FFTs,
and has a similar interpretation as Figure 2.
Notice, that this is the case for which the Xeon
out-performs the Power Challenge the most,
with the four processors running about fourteen times faster
than one R8000.
The Origin 200 and the dual-processor Pentium III
scale the worse for the FFTs,
probably because of slower caches.
Small-All
Figure 1
Relative speeds as a function of number of CPU for
all the computations in the small problem:
1) Power Challenge (FFTW),
2) Power Challenge (SGILIB),
3) O200 (FFTW),
4) O200 (SGILIB),
5) Dual-processor Pentium III (FFTW),
6) Four-processor Xeon (FFTW).
One processor Power Challenge has a speed of 1.
The dashed lines correspond to the ideal parallel speed up.

Small-par-All
Figure 2
Relative speeds as a function of number of CPU for
all the parallel computations in the small problem:
1) Power Challenge (FFTW),
2) Power Challenge (SGILIB),
3) O200 (FFTW),
4) O200 (SGILIB),
5) Dual-processor Pentium III (FFTW),
6) Four-processor Xeon (FFTW).
One processor Power Challenge has a speed of 1.
The dashed lines correspond to the ideal parallel speed up.

Small-fft-All
Figure 3
Relative speeds as a function of number of CPU for
the computations of the FFTs in the small problem:
1) Power Challenge (FFTW),
2) Power Challenge (SGILIB),
3) O200 (FFTW),
4) O200 (SGILIB),
5) Dual-processor Pentium III (FFTW),
6) Four-processor Xeon (FFTW).
One processor Power Challenge has a speed of 1.
The dashed lines correspond to the ideal parallel speed up.


Next: Large problem results
Up: SPLIT-STEP MIGRATION
Previous: SPLIT-STEP MIGRATION
Stanford Exploration Project
10/25/1999


