


Earth satellites orbiting over the poles go round us in north-flying tracks and south-flying tracks. Their orbits would be north-south lines, but the earth's rotation causes them to appear to drift westward (with the sun) so the north-going runs leave northwest-going tracks and the southward runs leave southwest-going tracks. Figure 10 shows an interesting topography striated in two non-orthogonal directions (much like superposed plane waves ;-) and some tracks. For my convenience I have plotted northwest tracks in a vertical direction and southwest tracks in a horizontal direction. In reality the track types are not orthogonal, so my displays will have a shearing distortion (not affecting the analysis). The satellites considered here measure sea surface altitude. You might think the sea surface should be at the same altitude everywhere, but the gravitational attraction of the mountains beneath the sea causes the altitude of sea level to vary from place to place. It would be an arduous task to survey all the oceans to find their depth and map it, or to map the strength of gravity on all the ocean surfaces, but either map looks much like each other and both look like the satellite altimeter map, the differences being mainly in calibration and spatial filtering.
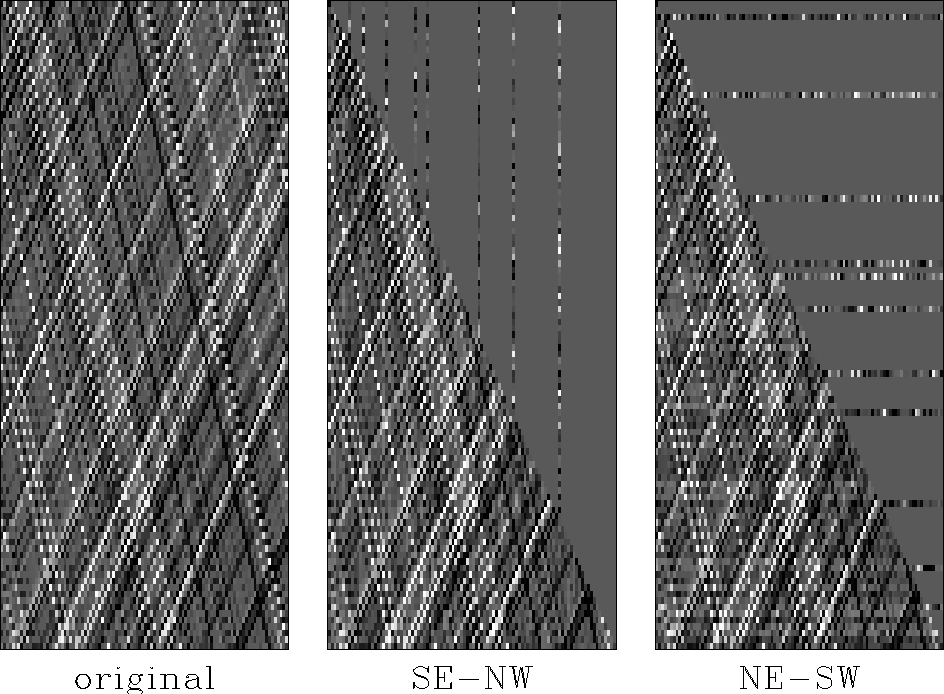 |


There is great track density below ![]() south latitude,
but it is much sparser above.
Most satellite tracks are missing north of the
south latitude,
but it is much sparser above.
Most satellite tracks are missing north of the
![]() south latitude because
knowledge of the distribution of gravity is required
to guide a ballistic missile to a precise target,
so they are secret.
The tracks north of
south latitude because
knowledge of the distribution of gravity is required
to guide a ballistic missile to a precise target,
so they are secret.
The tracks north of ![]() south latitude come from other satellites.
south latitude come from other satellites.
Notice that some tracks are brighter and some are dimmer. This mimics a calibration problem that causes each track to have a different mean, or more generally, a very low-frequency, along-the-track noise.
Although the geometry of Figure 10 is somewhat unusual, it is an attractive example for study for several reasons. First, it exhibits the familiar problem that survey lines are never as dense as we wish them to be. Second, it is not unusual for crossing lines to have inconsistency. Third, having dense coverage near sparse coverage offers us a good chance to study the transition from a region of high information density to a region of low density and ambiguity (spatial aliasing).
The obvious way to fill in between the tracks is with some kind of smoothness criterion. For example, we could have the solution fit the track data exactly and between the tracks we could have the solution satisfy Laplace's equation. For Figure 11, I chose instead to minimize the energy in the output of the Laplacian operator (which amounts to satisfying the squared Laplace equation). The problem with either of these approaches is the implicit presumption of isotropy, i.e., that the interpolation be independent of orientation. The best result is obviously the last one in Figure 11 and we'll explore that next.