|
cube
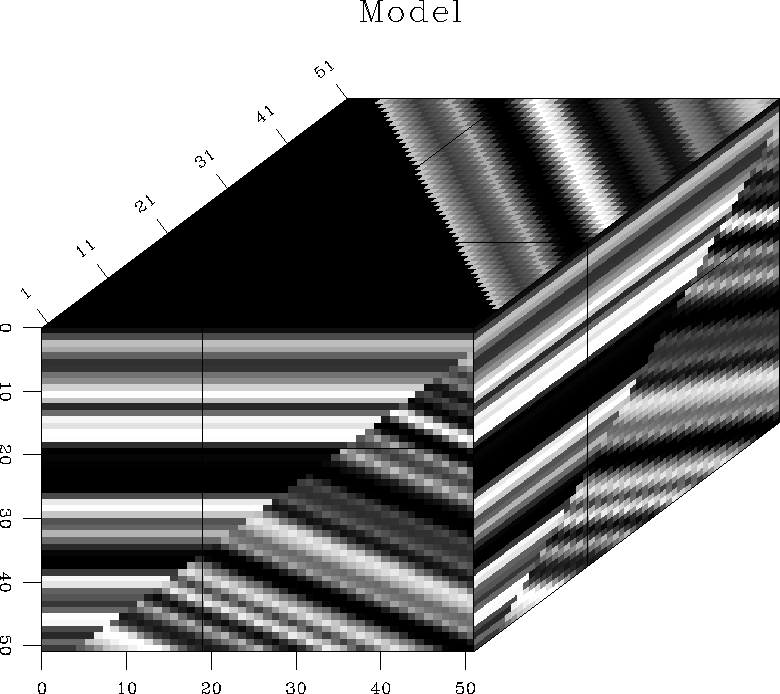
Figure 4 A synthetic model, showing a fault between two plane waves of different slopes. |  |
|
cube
Figure 4 A synthetic model, showing a fault between two plane waves of different slopes. |  |
 |
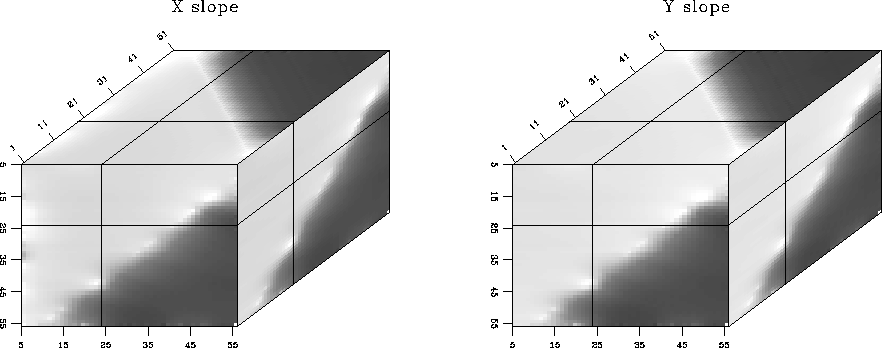
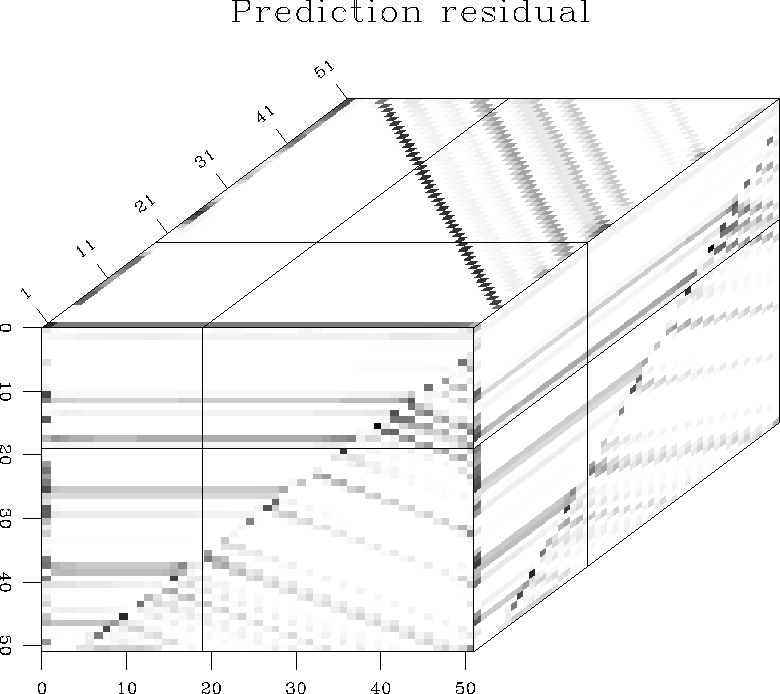
Figure 4 shows a simple synthetic model of two plane waves, separated by a plane fault. The slope estimates for the two orthogonal directions are shown in Figure 5. We can see that the estimation procedure correctly identified the regions of constant slope. Finally, estimating a local 3-D plane-wave predictor by spectral factorization and convolving the resultant non-stationary filter with the input model, we obtain the prediction residual, shown in Figure 6. In the residual, both plane waves are effectively destroyed, and we observe a sharp image of the fault plane. This result compares favorably with results of alternative methods, collected by Schwab (1998).
|
cmain
Figure 6 Magnitude of the residual after convolving the synthetic two-plane model with a local 3-D plane wave filter. |  |