 |
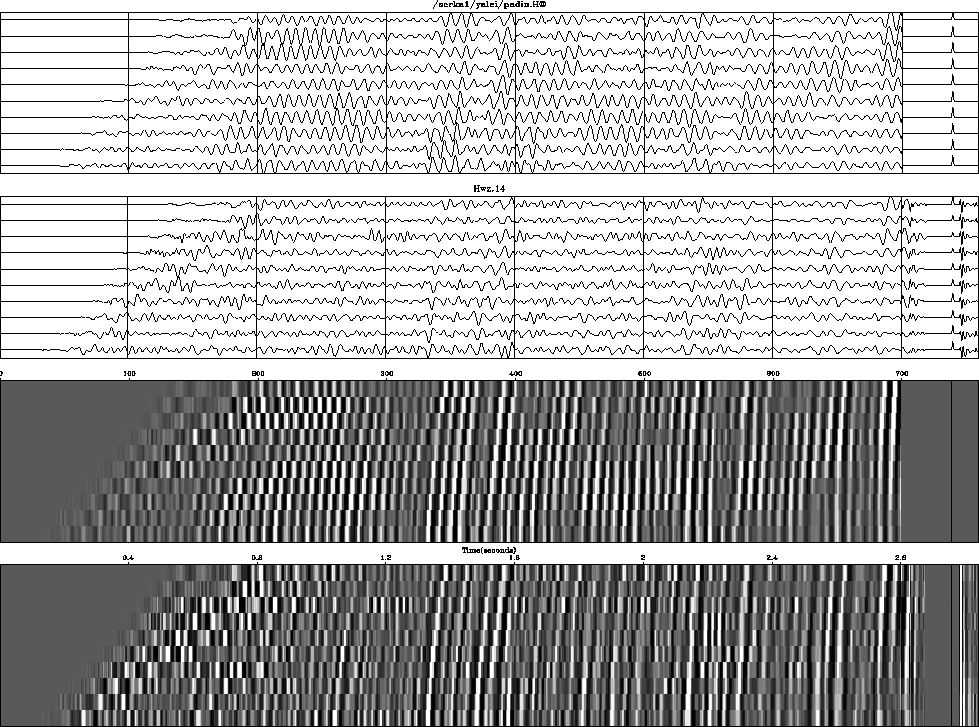
Figure 9 Data from offshore Texas (extracted from Yilmaz and Cumro dataset 14). Wiggle display above and raster below. Inputs above outputs. Filters displayed on the right.
Figure 9 is a nice illustration of the utility of prediction-error filters.
 |
The input is quasi-sinusoidal, which indicates that PE filtering should be successful. Indeed, some events are uncovered that probably would not have been identified on the input. In this figure, a separate problem is solved for each trace, and the resulting filter is shown on the right.