 |
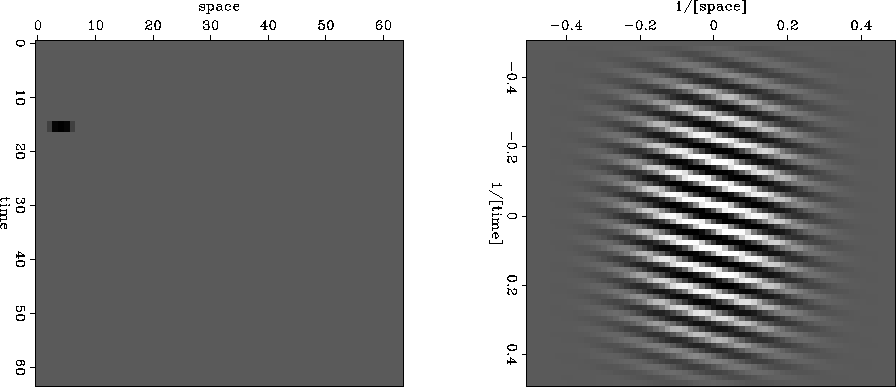
Figure 5 A broadened pulse (left) and the real part of its FT (right).
An example of a two-dimensional Fourier transform of a pulse is shown in Figure 5.
 |
Notice the location of the pulse. It is closer to the time axis than the frequency axis. This will affect the real part of the FT in a certain way (see exercises). Notice the broadening of the pulse. It was an impulse smoothed over time (vertically) by convolution with (1,1) and over space (horizontally) with (1,4,6,4,1). This will affect the real part of the FT in another way.
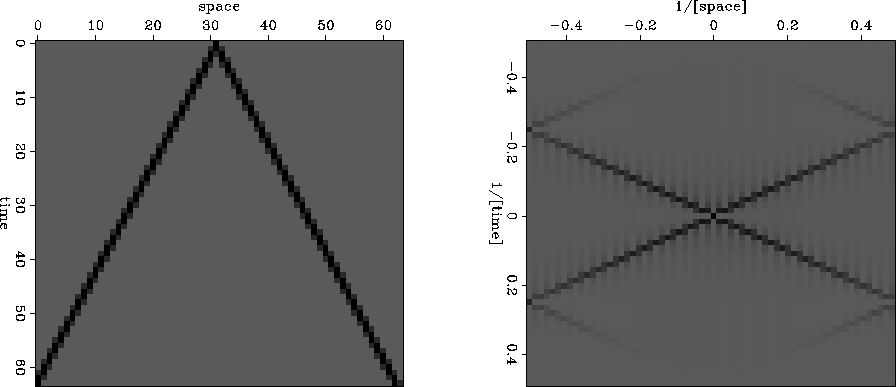
Another example of a two-dimensional Fourier transform is given in Figure 6. This example simulates an impulsive air wave originating at a point on the x-axis. We see a wave propagating in each direction from the location of the source of the wave. In Fourier space there are also two lines, one for each wave. Notice that there are other lines which do not go through the origin; these lines are called ``spatial aliases.'' Each actually goes through the origin of another square plane that is not shown, but which we can imagine alongside the one shown. These other planes are periodic replicas of the one shown.
 |