Next: Conclusions
Up: Lateral velocity variations
Previous: Lateral velocity variations
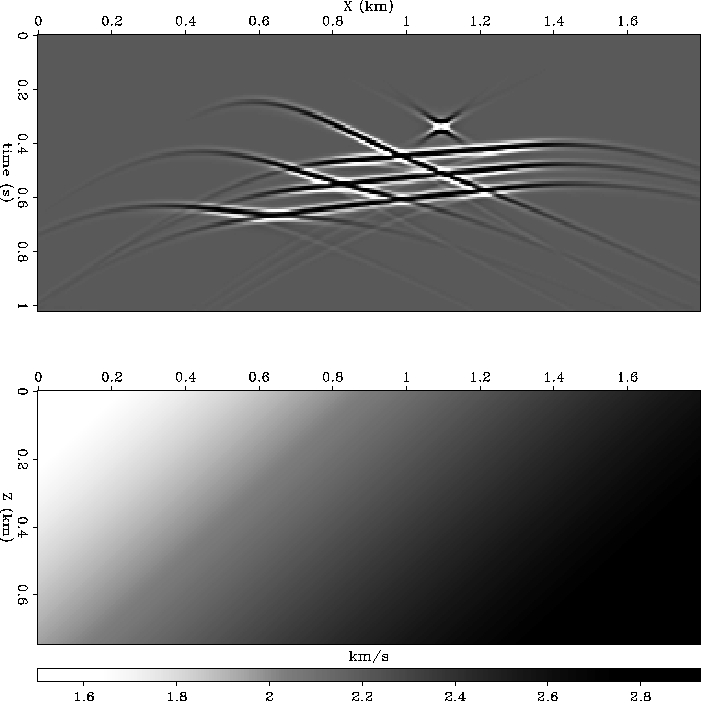
Figure 4 shows 2-D cross-sections through the simple 3-D
synthetic model used to test lateral velocity variations.
The velocity model consisted of a linear gradient of 0.85
s-1 dipping at 45.The reflectivity model consisted of three `bench'-shaped
reflectors with dips of 15, 35 and 50. The
synthetic data were modeled with a Kirchhoff method, and a dip-limited
impulse was added to the zero-offset section to illustrate the 3-D
nature of the algorithm.
model
Figure 4 Cross-sections through zero-offset
reflectivity model (top), and laterally variable velocity model
(bottom).


For the migration, we used 20 reference velocities, and truncated
filter coefficients when they became 103 times smaller than the
leading value, with a maximum of 20 points.
Filters contained 8-10 coefficients for average frequencies.
Figure 4 shows the results of the migration.
The three dipping beds are well imaged in cross-section, and in the
depth-slice the effect of the velocity gradient is apparent
from the slight azimuthal anisotropy of the impulse response.
Next: Conclusions
Up: Lateral velocity variations
Previous: Lateral velocity variations
Stanford Exploration Project
5/1/2000