|
syn+.2
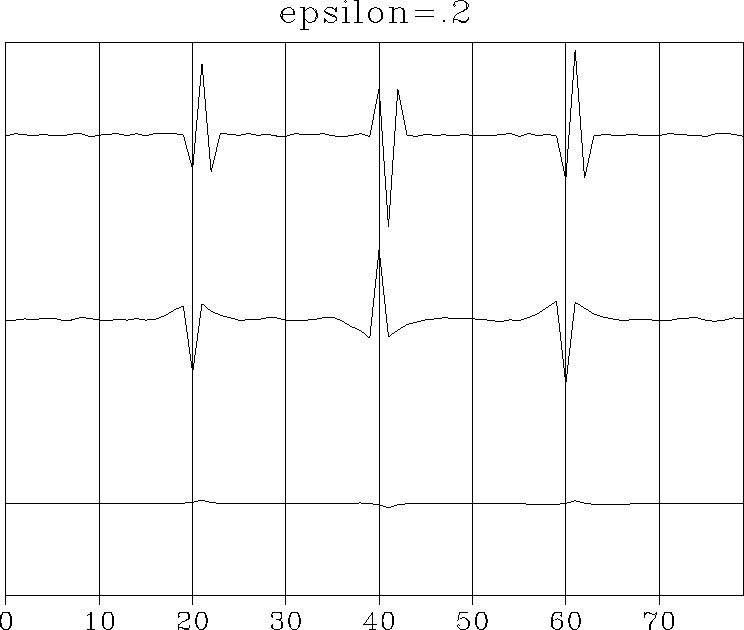
Figure 2 Top is the synthetic data yt. Middle is the deconvolved data xt. Bottom is the noise nt. This choice of |  |
|
syn+.2
Figure 2 Top is the synthetic data yt. Middle is the deconvolved data xt. Bottom is the noise nt. This choice of |  |
The plot in Figure 2
is for the value of ![]() that I subjectively
regarded as best.
The result is pleasing because the doublets
tend to be converted to impulses.
Unfortunately, the low-frequency noise in xt is significantly
stronger than that in yt, as expected.
that I subjectively
regarded as best.
The result is pleasing because the doublets
tend to be converted to impulses.
Unfortunately, the low-frequency noise in xt is significantly
stronger than that in yt, as expected.
Taking ![]() larger will decrease ||X|| but increase
the explicit noise ||Y-BX||.
To decrease the explicit noise, I chose a tiny value of
larger will decrease ||X|| but increase
the explicit noise ||Y-BX||.
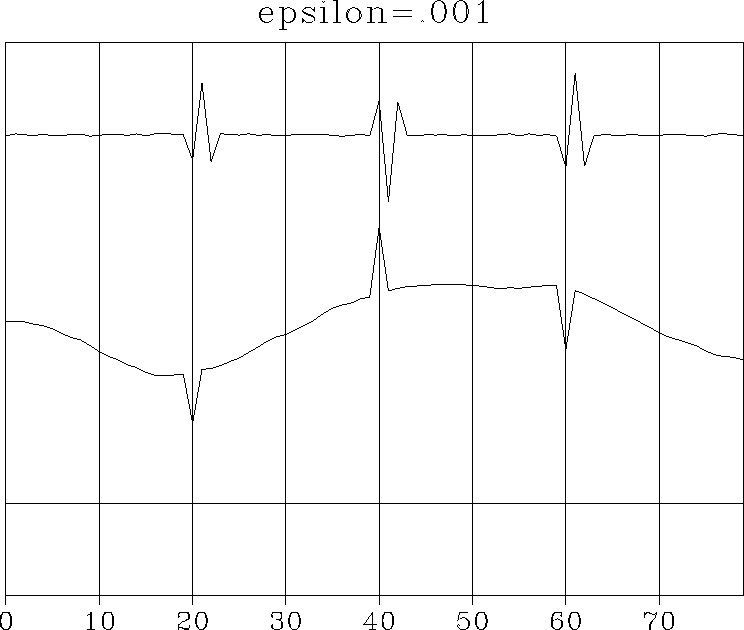
To decrease the explicit noise, I chose a tiny value of ![]() .Figure 3 shows the result.
The explicit noise nt appears to vanish,
but the low-frequency noise
implicit to the deconvolved output xt has grown unacceptably.
.Figure 3 shows the result.
The explicit noise nt appears to vanish,
but the low-frequency noise
implicit to the deconvolved output xt has grown unacceptably.
|
syn+.001
Figure 3 As before, the signals from top to bottom are yt, xt, and nt. Choosing a small |  |
Finally, I chose a larger value of ![]() to allow more noise
in the explicit nt, hoping to get
a lower noise implicit to xt.
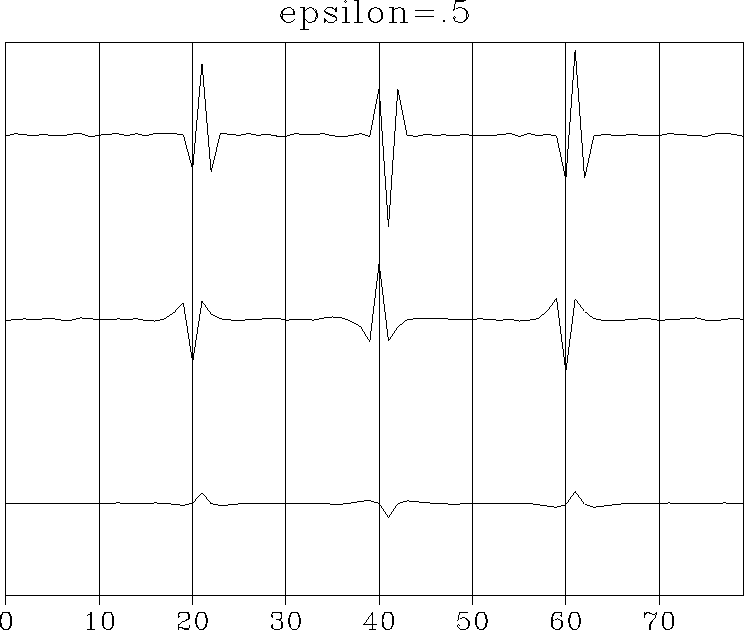
Figure 4 shows the result.
to allow more noise
in the explicit nt, hoping to get
a lower noise implicit to xt.
Figure 4 shows the result.
|
syn+.5
Figure 4 Noise essentially explicit. |  |
Besides the growth of the explicit noise (which is disturbingly correlated to the input), the deconvolved signal has the same unfortunate wavelet on it that we are trying to remove from the input.
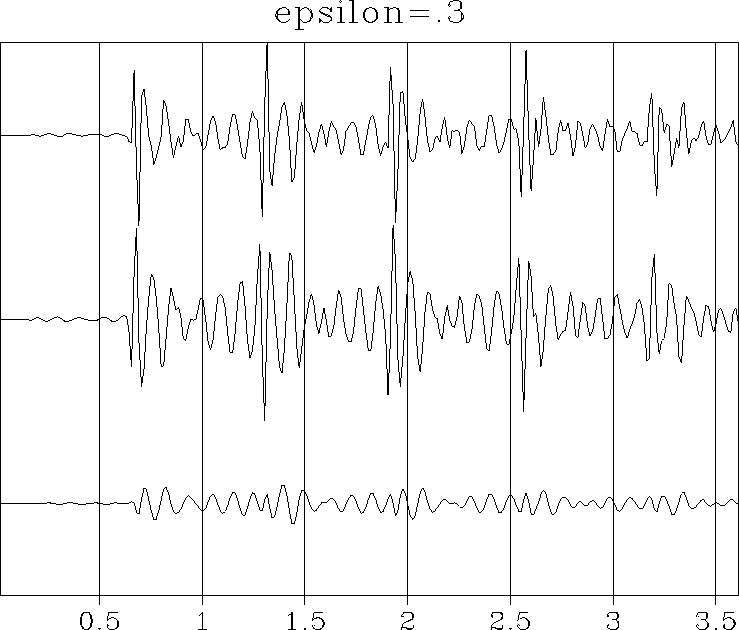
Results of a field-data test shown in Figure 5 do not give reason for encouragement.
In conclusion,
all data recording has an implicit filter,
and this filter is arranged to make the data look good.
Application of a theoretical filter,
such as ![]() ,may achieve some theoretical goals,
but it does not easily achieve practical goals.
,may achieve some theoretical goals,
but it does not easily achieve practical goals.
|
field+.3
Figure 5 Field-data test. As before, the signals from top to bottom are yt, xt, and nt. |  |