

Next: Regressing simultaneously before and
Up: A model with both
Previous: Reverberation
Seismic ``signature" is defined to be a convolutional
filtering on impulse-source data.
This convolution models the nonimpulsive nature of real sources.
Imagine the oscillation of a marine airgun's bubble.
On land, the earth's near surface can have a very slow velocity.
There Snell's law will bend all rays to very near vertical incidence.
Mathematically, such reverberations in such layers
are indistinguishable from source signature.
For example, in California the near-surface
soils
often have
a velocity near the air velocity (340 m/s)
that grades toward the water velocity (1500 m/s).
A buried shot typically has a free-surface reflection ghost
whose time delay is virtually independent of angle.
Thus the ghost is more like signature than multiple.
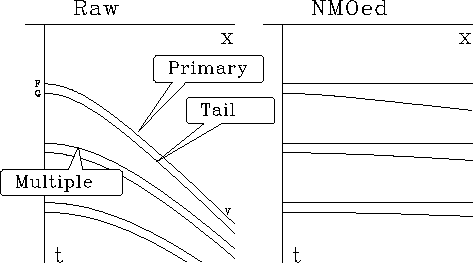
Synthetic data in Figure 7 shows the result of
convolution before and after NMO.
An event labeled ``G" marks the tail-end of the source signature.
deep
Figure 7
Example of convolution before and after NMO.
The raw data shows a uniform primary-to-tail interval,
while the NMO'ed data shows uniform multiple reverberation.
The letters F, G, and V are adjustable parameters
in the interactive program controlling water depth,
signature tail, and velocity.
|
|  |

The main idea illustrated by the figure is that
some events are equally spaced before NMO,
while other events are equally spaced after NMO.
We will see that proper deconvolution requires
a delicious mixture of NMO and deconvolution principles.
Figure 7 happens to have
a short time constant with the signature
and a longer one with the reverberation.
The time constants would be reversed
in water shallow compared with the gun's quieting time.
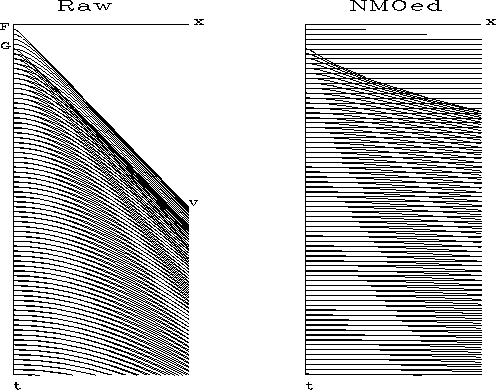
This is shown in Figure 8.
shallow
Figure 8
Model in water shallow compared to gun quieting time.
|
|  |

This figure shows an interesting interference pattern
that could also show up in amplitude versus offset studies.


Next: Regressing simultaneously before and
Up: A model with both
Previous: Reverberation
Stanford Exploration Project
10/21/1998

