Let P denote raw data and Q denote filtered data.
When seismic data is quasimonochromatic,
dip filtering can be achieved with spatial frequency filters.
The table below shows filters with an adjustable cutoff parameter ![]() .
.
| 2|c| | |
| 2|c|Dip Filters for Monochromatic
Data ( |
|
|---|---|
| 2|c| | |
| Low Pass | High Pass |
To apply these filters in the space domain it is necessary only to interpret k2 as the tridiagonal matrix T with (-1,2,-1) on the main diagonal. Specifically, for the low-pass filter it is necessary to solve a tridiagonal set of simultaneous equations like
| |
(21) |
Turn your attention from narrow-band data to data with a somewhat broader spectrum and consider
| 2|c| | |
| 2|c|Dip Filters for Moderate
Bandwidth Data ( |
|
|---|---|
| 2|c| | |
| Low Pass | High Pass |
 |
 |
Naturally these filters can be applied to data of any bandwidth. However the filters are appropriately termed ``dip filters'' only over a modest bandwidth.
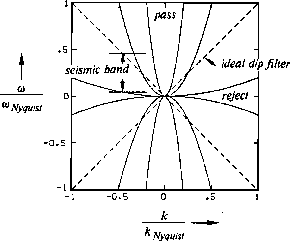
To understand these filters look in the ![]() -plane
at contours
of constant
-plane
at contours
of constant ![]() i.e.
i.e. ![]() .Such contours, examples of which are shown in Figure 3,
are curves of constant attenuation and constant phase shift.
.Such contours, examples of which are shown in Figure 3,
are curves of constant attenuation and constant phase shift.
|
dipfil
Figure 3 Constant-attenuation contours of dip filters. Over the seismic frequency band these parabolas may be satisfactory approximations to the dashed straight line. Pass/reject zones are indicated for the low-pass filter. (Hale) |  |
An interesting feature of these dip filters is that the low-pass and the high-pass filters constitute a pair of filters which sum to unity. So nothing is lost if a dataset is partitioned by them in two. The high-passed part could be added to the low-passed part to recover the original dataset. Alternately, once the low-pass output is computed, it is much easier to compute the high-pass output, because it is just the input minus the low-pass. The low-pass filter has no phase shift in the pass zone, but there is time differentiation in the attenuation zone. This is apparent from the defining equation. The high-pass filter has no phase shift in the flat pass zone, but there is time integration in the attenuating zone.