| t | = | travel time in the point-source field experiments. |
| t' | = | |
| = | time in the Snell pseudoexperiment with a moving source. |
Let us synthesize a downgoing Snell wave with field data, then imagine how the upcoming wave will look and how it will carry to us information about the subsurface.
Slant stacking will take the survey line data P(s,g,t), which is a function of shot location s, geophone location g, and travel time t, and sum over the shot dimension, thereby synthesizing the upcoming wave U(g,t), which should have been recorded from a downgoing Snell wave. This should be the case even though there may be lateral velocity variation and multiple reflections.
The summation process is confusing because three different kinds of time are involved:
| t | = | travel time in the point-source field experiments. |
| t' | = | |
| = | time in the Snell pseudoexperiment with a moving source. |
Time in the pseudoexperiment in a horizontally layered earth has the peculiar characteristic that the further you move out the geophone axis, the later the echoes will arrive. Transform directly from the field experiment time t to interpretation time t' by
| |
(26) |
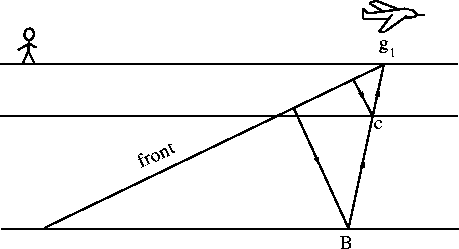
Figure 11 depicts a downgoing Snell wave.
 |
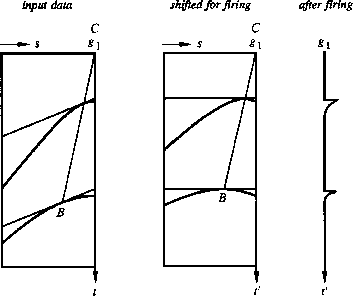
Figure 12 shows a hypothetical common-geophone gather, which could be summed to simulate the Snell wave seen at location g1 in Figure 11. The lateral offset of B from C is identical in Figure 11 with that in Figure 12 (at two places in Figure 12.
 |
Repeating the summation for all geophones synthesizes an upcoming wave from a downgoing Snell wave.
The variable t' may be called an interpretation coordinate, because shallow reflectors are seen just after t' = 0, and horizontal beds give echoes that arrive with no horizontal stepout, unlike the pseudo-Snell wave. For horizontal beds, the detection of lateral location depends upon lateral change in the reflection coefficient. In Figure 11, the information about the reflection strength at B is recorded rightward at g1 instead of being seen above B, where it would be on conventional stack. The moving of received data to an appropriate lateral location is thus an additional requirement for full interpretation.
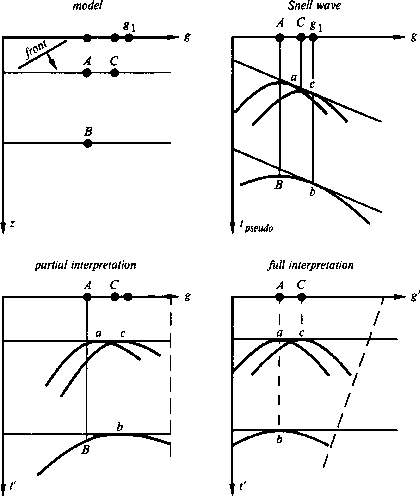
Figure 13 shows the same two flat layers as figures 1 and 2, but there are also anomalous reflection coefficients at points A, B, and C.
 |
Point A is directly above point B. The path of the wave reflected at B leads directly to C and thence to g1. Subsequent frames show the diffraction hyperbolas associated with these three points. Notice that the pseudo-Snell waves reflecting from the flat layers step out at a rate p. Hyperbolas from the scatterers A, B, and C come tangent to the Snell waves at points a, b, and c. Notice that b and c lie directly under g1 because all are aligned along a raypath with Snell parameter p. The points A, B, and C locate the tops of the hyperbolas since the earliest arrival must be directly above the point scatterer, no matter what the incident wavefield. Converting to the interpretation coordinate t' in the next frame offers the major advantage that arrivals from horizontal layers become horizontal. But notice that the hyperboloids have become skewed. Limiting our attention to the arrivals with little stepout, we find information about the anomalous reflection coefficients entirely in the vicinities of a, b, and c, points which originally lay on hyperbola flanks. These points will not have the correct geometrical location, namely that of A, B and C, until the data is laterally shifted to the left, to, say, g' =g-f ( t' ). Then a will lie above b. The correct amount of shift f(t' ) is a subject that relates to velocity analysis. The velocity analysis that pertains to this problem will be worked out in the next section.