|
fwidth
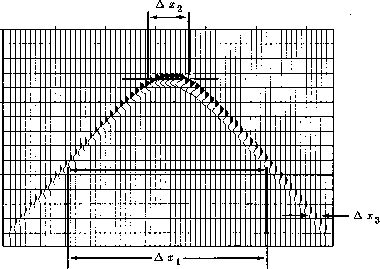
Figure 1 Measurements of width parameters of a hyperbola. |  |
In principle, migration converts hyperbolas to points. In practice, hyperbolas don't collapse to a point, they collapse to a focus. A focus has measurable dimensions. Migration is said to be ``good'' because it increases spatial resolution. It squeezes a large hyperbola down to a tiny focus. To quantitatively describe the improvement of migration, the size of the hyperbola and the size of the focus must be defined. Figure 1 shows various ways of measuring the size of a hyperbola.
|
fwidth
Figure 1 Measurements of width parameters of a hyperbola. |  |
The hyperbola carries an impulsive arrival.
So the ![]() -bandwidth of the hyperbola is roughly given
by the zero crossings on the time axis of the main energy burst.
I'll mention 50 Hz as a typical value, though you could encounter
values four times higher or four times lower.
Knowledge of a seismic velocity determines depth resolution.
I'll suggest 3 km/sec, though once again you could encounter velocities four
times greater or four times less.
These values imply a seismic wavelength of
-bandwidth of the hyperbola is roughly given
by the zero crossings on the time axis of the main energy burst.
I'll mention 50 Hz as a typical value, though you could encounter
values four times higher or four times lower.
Knowledge of a seismic velocity determines depth resolution.
I'll suggest 3 km/sec, though once again you could encounter velocities four
times greater or four times less.
These values imply a seismic wavelength of ![]() meters.
But the effective seismic wavelength is half the actual wavelength.
The half comes from halving the velocity v
in exploding reflector calculations,
or equivalently, from realizing that the seismic wavelength is
divided equally into upgoing and downgoing parts.
Resolving power is customarily defined as about half the
effective wavelength or about 15 meters.
(Whether seismic resolution should be
half
the effective wavelength
or a smaller fraction is an issue that involves
signal-to-noise considerations outside our present study).
meters.
But the effective seismic wavelength is half the actual wavelength.
The half comes from halving the velocity v
in exploding reflector calculations,
or equivalently, from realizing that the seismic wavelength is
divided equally into upgoing and downgoing parts.
Resolving power is customarily defined as about half the
effective wavelength or about 15 meters.
(Whether seismic resolution should be
half
the effective wavelength
or a smaller fraction is an issue that involves
signal-to-noise considerations outside our present study).
The lateral resolution requires estimates of hyperbola width and focus width.
Figure 1 shows three hyperbola widths.
The widest, ![]() , includes about three-quarters of the
energy in the hyperbola.
Next is the width
, includes about three-quarters of the
energy in the hyperbola.
Next is the width ![]() , called the
Fresnel Zone.
It is measured across the hyperbola at the time when the first
arrival has just changed polarity.
Third is the smallest measurable width, found far out on a flank.
This width,
, called the
Fresnel Zone.
It is measured across the hyperbola at the time when the first
arrival has just changed polarity.
Third is the smallest measurable width, found far out on a flank.
This width, ![]() ,is the shortest horizontal wavelength to be found.
Resolution is the study of the size of error, and it is
not especially useful to be precise about the error in the error.
The main idea is that
,is the shortest horizontal wavelength to be found.
Resolution is the study of the size of error, and it is
not especially useful to be precise about the error in the error.
The main idea is that ![]() .The bandwidth of the spatial kx spectrum
is roughly
.The bandwidth of the spatial kx spectrum
is roughly ![]() .How small a focus can migration make?
It will be limited by the available bandwidth in the kx spectrum.
The size of the focus will be about
the same as
.How small a focus can migration make?
It will be limited by the available bandwidth in the kx spectrum.
The size of the focus will be about
the same as ![]() .
.
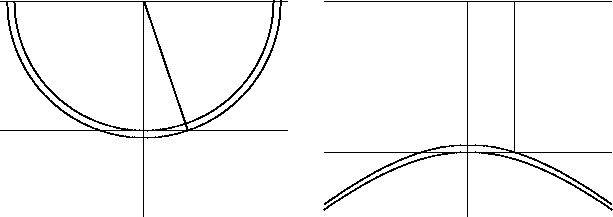
Figure 2 shows the geometry of the Fresnel zone concept.
|
fresnel
Figure 2 Fresnel zone in (x,z)-space (left) and in (x,t)-space (right). |  |
A Fresnel zone is an intercept of a spherical wave with a plane.
The intercept is defined when the spherical wave penetrates
the plane to a depth of a half wavelength.
What is the meaning of the Fresnel width ![]() ?
Imagine yourself in Berlin.
There was a wall there.
You could not go near it.
Imagine a hole in the wall.
You are shouting to a friend on the opposite side.
How does the loudness of the sound depend on the size of
the hole
?
Imagine yourself in Berlin.
There was a wall there.
You could not go near it.
Imagine a hole in the wall.
You are shouting to a friend on the opposite side.
How does the loudness of the sound depend on the size of
the hole ![]() ?
It is not obvious, but it is well known, both
theoretically and experimentally, that holes larger
than the Fresnel zone cause little attenuation, but smaller holes
restrict the sound in proportion to their size.
?
It is not obvious, but it is well known, both
theoretically and experimentally, that holes larger
than the Fresnel zone cause little attenuation, but smaller holes
restrict the sound in proportion to their size.
Wave propagation is a convolutional filter that smears information
from a region ![]() along a reflector
(or
along a reflector
(or ![]() in the subsurface).
Migration, the reverse of wave propagation,
is the deconvolution operation.
The final amount of lateral resolution is limited by the spatial bandwidth
of the data.
in the subsurface).
Migration, the reverse of wave propagation,
is the deconvolution operation.
The final amount of lateral resolution is limited by the spatial bandwidth
of the data.
Migration may be called for even where reflectors show no dip.
When a well site is to be chosen
within an accuracy of less than ![]() then
the interpreter is looking at subtle changes in amplitude
or waveform along the reflector.
Migration causes these amplitude and waveform variations to change
and to move horizontally along the reflector.
The distance moved is about equal the Fresnel zone.
then
the interpreter is looking at subtle changes in amplitude
or waveform along the reflector.
Migration causes these amplitude and waveform variations to change
and to move horizontally along the reflector.
The distance moved is about equal the Fresnel zone.
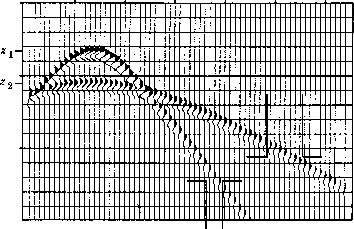
A basic fact of seismology is the resolution limitation caused by the increase with depth of the seismic velocity. What happens is that as the waves get deeper into the earth, their spatial wavelengths get longer because of the increasing velocity. The case of vertical resolution is simply this: longer wavelengths, less resolution. The case of horizontal resolution is similar, but the horizontal wavelength is directly measurable at the earth's surface. Figure 3 demonstrates this.
|
hyp2
Figure 3 Hyperboloids for an earth of velocity increasing with depth. Observable lateral wavelengths get longer with increasing depth. Thus lateral resolving power decreases with depth. |  |
Hyperboloids from shallow and deep scatterers are shown. Shallow hyperbolas have early tops and steep asymptotes. Deep scatterers have late tops and less steep asymptotes. The less steep asymptotes have longer horizontal wavelength. Horizontal wavelengths measured at the surface are unchanged at depth, even though velocity increases with depth. Thus, lateral spatial resolution gets worse with depth. Compounding the above reason for decreasing resolution is the loss of high-frequency energy at late travel time.