 |
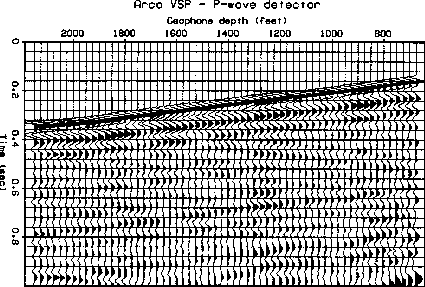
Figure 4 Vertical seismic profile. The source is at the earth's surface near the borehole. The horizontal axis is the receiver depth. The vertical axis is travel time from zero to one second. Amplitudes are scaled by t1.5. (ARCO)
Seismologists always welcome the additional information from a vertical seismic profile (VSP). A VSP is some collection of seismograms recorded from the surface to a borehole. Routine well-based measurements such as rock cuttings and electric logs record local information, often just centimeters from the well. It is nice to think of the earth as horizontal strata, but this idealization fails at some unknown distance from the well. Surface reflection seismology, although it is further from the ``ground truth'' of well-bore measurements, provides the needed information about lateral continuity. But surface reflection data has resolving-power limitations as well as other uncertainties. The VSP provides information at an intermediate scale and also provides a calibration of the surface seismic method. Unfortunately, VSPs are costly and we rarely have them.
The subject of VSP occupies several books and many research papers. (See Gal'perin [1974] and Balch et al [1982]). Here we will just look at a single VSP to get some idea of source waveforms and multiple reflections. The VSP shown in Figure 4 is from a typical land area.
 |
The multiple reflections are not so severe as with the marine data shown elsewhere in this chapter. The earliest arrival in Figure 4 is the primary downgoing wave. Downgoing waves increase their travel time with depth, the slope of the arrival curve giving the downward component of velocity. After the first downgoing waves arrive, you can see more downgoing waves with the same velocity. Upgoing waves have the opposite slope of the downgoing waves. These are also visible in Figure 4.
Since late echoes are weaker than early ones, seismic data is normally scaled upwards with time before being displayed. There is no universal agreement in either theory or practice of what scaling is best. I have usually found t2 scaling to be satisfactory for reflection data. Figure 4 shows that t1.5 scaling keeps the first arrival at about a constant amplitude on the VSP.
Viewing Figure 4 from the side shows that the downgoing pulse is followed by a waveform that is somewhat consistent from depth to depth. The degree of consistency is not easy to see because of interference with the upcoming wave. As far as I can tell from the figure, the downgoing wave at the greatest depth is equal to that at the shallowest depth.
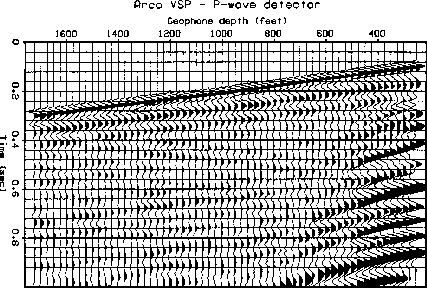
Figure 5 shows the same data augmented by some shallow receivers.
 |
You will notice that the downgoing wave no longer seems to be independent of depth. So we can conclude that, as a practical matter, the downgoing waveform seems to be mainly a result of near-surface reverberation.
The energy in the first burst in Figure 4 is roughly comparable to the remaining energy. The remaining energy would be less if the VSP were displayed without t1.5 scaling, but since the surface reflection data is normally displayed with some such scaling (often t2), it makes more sense statistically to speak of the energy on the scaled data. So the reverberating energy is roughly comparable to the first arriving energy.
Below the near-surface region, the downgoing wave changes slowly with depth. Now we should ask how much the downgoing wave would change if the experiment were moved laterally. Obviously the borehole will not move laterally and we will be limited to data where only the surface source moves laterally. Since near-surface variations often change rapidly in the lateral direction, we may fear that the downgoing waveform also changes rapidly with shot location. The reverberation near a shot is repeated similarly near any surface receiver. The resulting composite reverberation is the convolution of near-shot reverberation and near-geophone reverberation. So to get the information needed to deconvolve surface seismic data, the VSP should be recorded with many surface source locations.
Unfortunately such offset VSP data is rarely available. When petroleum production declines and expensive secondary recovery methods are contemplated, the cost of VSP will not seem so high. The production lost during VSP acquisition may be more easily weighed against future gains.
Again we should think about the meaning of ``bad'' data. Seismic data is generally repeatable whenever it is above the level of the ambient microseismic noise. But often the signals make no sense. The spatial correlations mean nothing to us. Most data at late times fits this description. Perhaps what is happening is this: (1) The downgoing waveform is getting a long trail; (2) the trail is a chaotic function of the surface location; and (3) the energy in the trail exceeds the energy in the first pulse. So, with so much randomness in the downgoing wave, the upcoming wave is necessarily incomprehensible.