Before going any further, let us review some basic facts about two-dimensional Fourier transform. A two-dimensional function is represented in a computer as numerical values in a matrix, whereas a one-dimensional Fourier transform in a computer is an operation on a vector. A 2-D Fourier transform can be computed by a sequence of 1-D Fourier transforms. We can first transform each column vector of the matrix and then each row vector of the matrix. Alternately, we can first do the rows and later do the columns. This is diagrammed as follows:

The diagram has the
notational problem that we cannot maintain
the usual convention of using a lower-case letter for the domain
of physical space and an upper-case letter for the Fourier domain,
because that convention cannot include
the mixed objects P(t , kx ) and ![]() .Rather than invent some new notation, it seems best to let the reader
rely on the context:
the arguments of the function must help name the function.
.Rather than invent some new notation, it seems best to let the reader
rely on the context:
the arguments of the function must help name the function.
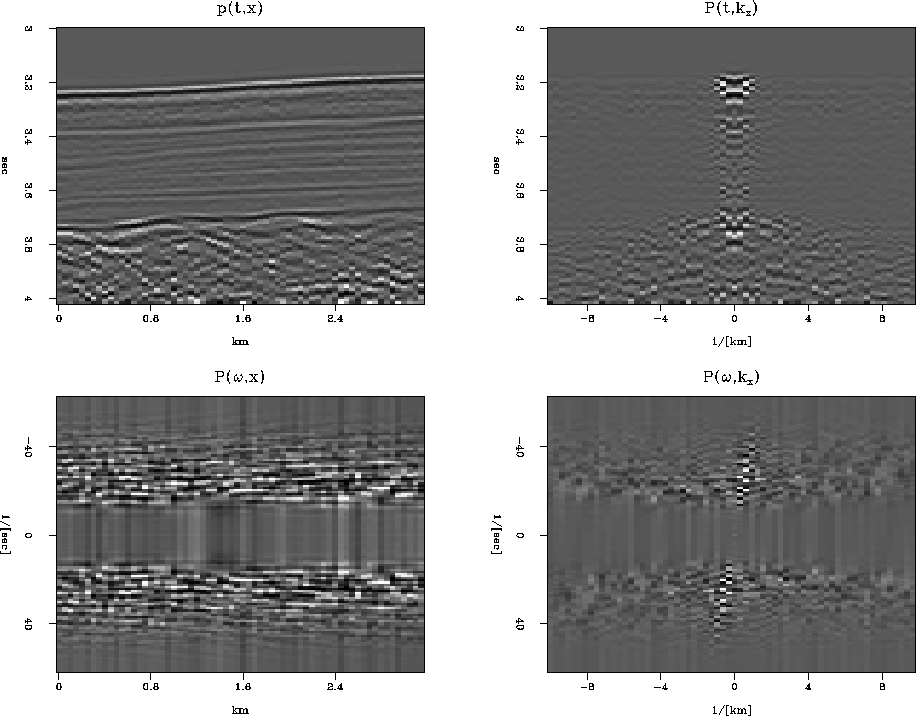
An example of two-dimensional Fourier transforms on typical deep-ocean data is shown in Figure 1.
 |
In the deep ocean, sediments are fine-grained and deposit slowly in
flat, regular, horizontal beds.
The lack of permeable rocks such as sandstone severely reduces
the potential for petroleum production from the deep ocean.
The fine-grained shales overlay irregular, igneous, basement rocks.
In the plot of P(t , kx ), the lateral continuity of the
sediments is shown by the strong spectrum at low kx.
The igneous rocks show a kx spectrum
extending to such large kx that the deep data may be somewhat
spatially aliased
(sampled too coarsely).
The plot of ![]() shows that the data contains no
low-frequency energy.
The dip of the sea floor shows up in
shows that the data contains no
low-frequency energy.
The dip of the sea floor shows up in ![]() -space as
the energy crossing the origin at an angle.
-space as
the energy crossing the origin at an angle.
Altogether, the two-dimensional Fourier transform of a collection of seismograms involves only twice as much computation as the one-dimensional Fourier transform of each seismogram. This is lucky. Let us write some equations to establish that the asserted procedure does indeed do a 2-D Fourier transform. Say first that any function of x and t may be expressed as a superposition of sinusoidal functions:
| |
(10) |