

Next: Discussion
Up: Plane-wave misfit by correlation
Previous: Plane-wave misfit by correlation
Overall, the correlation of the best-fitting plane wave is
the my most successful discontinuity attribute.
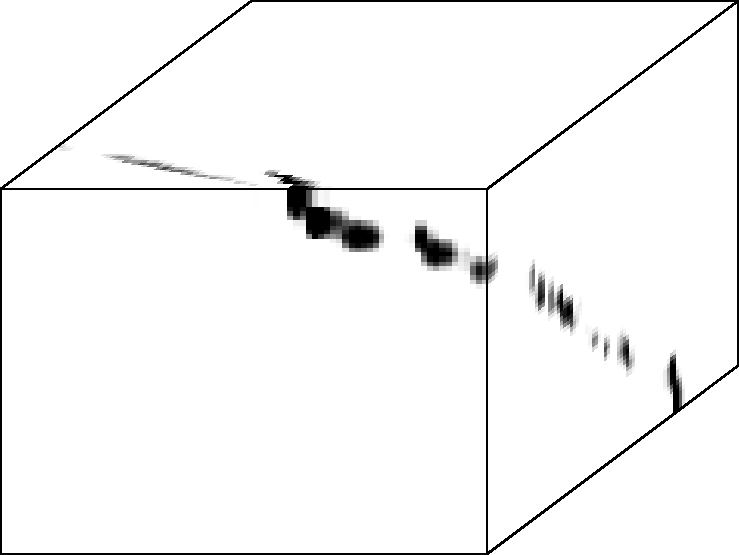
The synthetic test case shown in Figure 32
overall delineates the fault.
At the cube's side views,
the elongated events that constitute the fault
indicate the attribute's loss of vertical resolution.
In contrast, the fault is sharply defined in the top view.
Unfortunately,
the increased lateral resolution causes
the fault line to be interrupted
where adjacent layers lack contrast.
zeroFoltPPC
Figure 32
Correlation of local plane-wave estimate and original image.
The fault is resolved sharply laterally, but is blurred vertically.
The sharp lateral resolution leads to gaps in the fault line
where the original adjacent layers lack contrast.
|
|  |


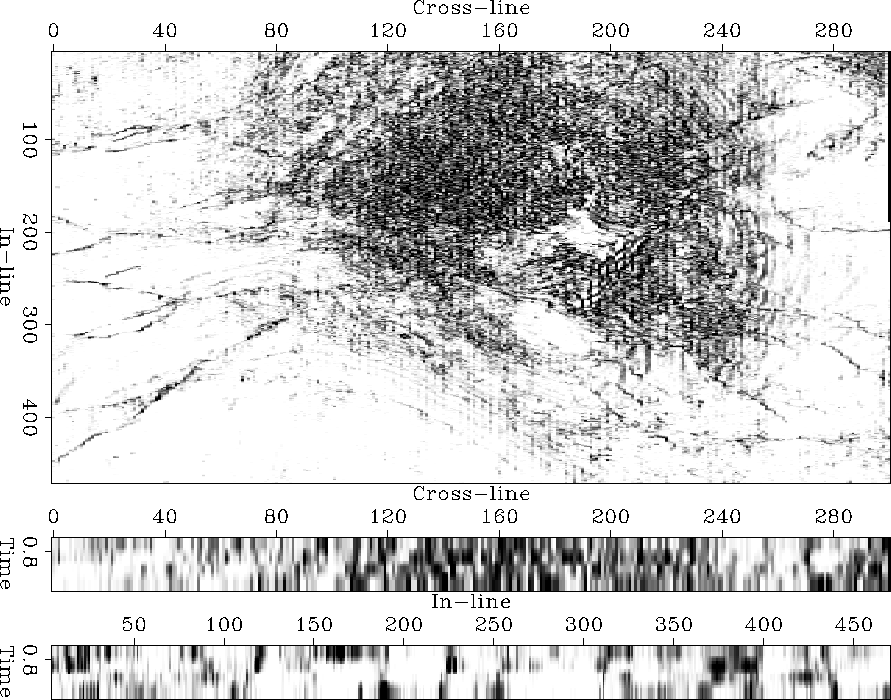
The first seismic test case in Figure 33
is a success.
The wavefield character of the image due to the sedimentary layers
vanished.
The major faults are delineated, particular the
large fault in the south-west corner.
The faults are sharply resolved, and contrast well with the otherwise
eventless background.
Unfortunately, the image shows a few shortcomings.
In some locations, the image shows a distinct ringing that
seems to be due to insufficiently suppressed, steeply dipping
layers. The salt body and its internal chaotic reflections obscure
the center of the image. The pentagonoid region is not delineated,
nor are the major truncating faults within the salt body.
In places, the image shows some
distinct north-south streaks,
which I believe are due to the acquisition footprint
that is also visible in the original image.
The
loss of resolution and
lack of faults
in the vertical sections of Figure 33
is due to the correlation over time.
The distinct border between the upper and lower data part indicates
that the patch size should possibly be reduced.
Overall,
the quality of the discontinuity image seems comparable to the quality of
commercial discontinuity maps (); Bahorich and Farmer (1995).
My salt dome image is a subimage of one of Bahorich's examples and
the attributes can be compared directly.
gulfFoltTotPPC
Figure 33
Plane-wave correlation applied to the salt image.
The image's time slice successfully delineates the subsurface faults
and is easily interpreted.


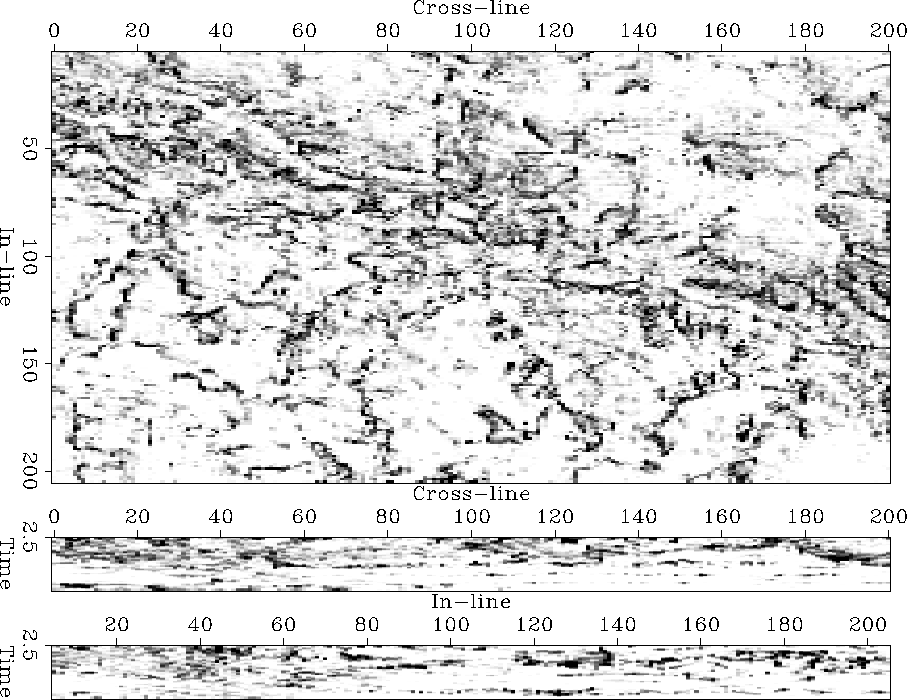
The discontinuity image of Figure 34
suppresses the wavefield character of the original image,
which was not excessive in the first place. The discontinuity
map reveals a complex pattern of numerous faults and discontinuities.
The discontinuities are well resolved.
The discontinuity map is slightly contaminated with noise, which
reduces the sharpness and contrast of the individual events and which
is most-visible in the image's center.
The noise might be due to
events that only partially fall within the correlation's temporal
averaging.
The vertical section indicate that a few strong sedimentary layers
at the bottom were not suppressed well.
Are the image's discontinuities truthfully delineated?
The faults that I can identify in the original image
all correspond to events of the discontinuity map.
Some of the events - e.g., the fault marked F
in the original image 12 -
deviate from the rather continuous and smooth event
that I detect in the original seismic image. Other
equally strong events of the discontinuity image seem
to relate to what amounts to small, hardly visible
discontinuities in the original image.
If my observations are correct,
one may argue that the discontinuity attribute fails
to distinguish between major and minor discontinuities.
On the other hand, the method deserves credit for
detecting such minor discontinuities.
nseaFoltTotPPC
Figure 34
Plane-wave correlation applied to the horst image.
The discontinuities of the image are delineated and the
image offers a distinctively different and informative
view of the subsurface.


Next: Discussion
Up: Plane-wave misfit by correlation
Previous: Plane-wave misfit by correlation
Stanford Exploration Project
3/8/1999


