

Next: Plane-wave misfit by correlation
Up: Backprojection of residual
Previous: Backprojection of residual
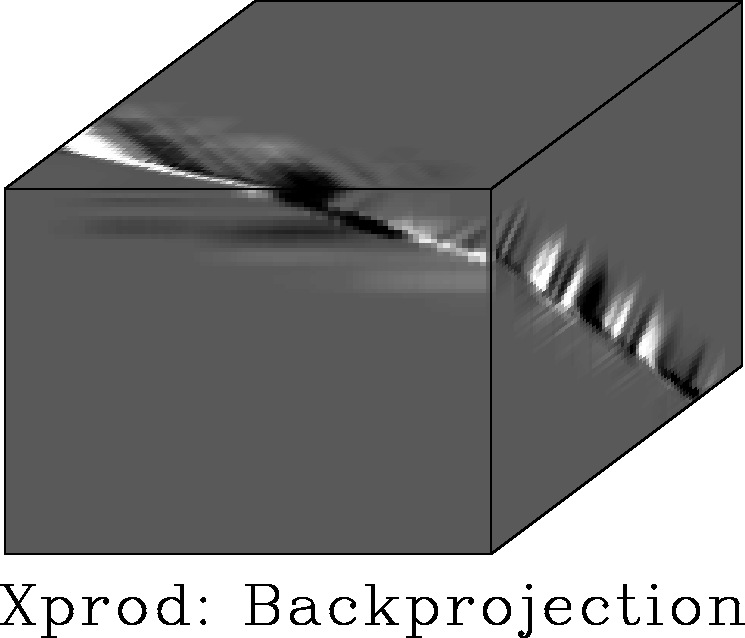
The backprojected residual of the synthetic image example
(Figure 28)
resembles the individual components of the crossproduct operator.
The fault is outlined but directly bordered by large residual
amplitudes of the neighboring plane wave regions.
Consequently, the resolution is about the size of the patch.
Otherwise, the plane wave patches away from the discontinuity are zeroed.
zeroFoltDXGAA
Figure 28
Forward and adjoint of cross-product operator applied to
the synthetic image.
The back-projected residual of
the synthetic test image
suppresses the pure plane-wave patches of the image and
broadly delineates the input's fault location.
|
|  |


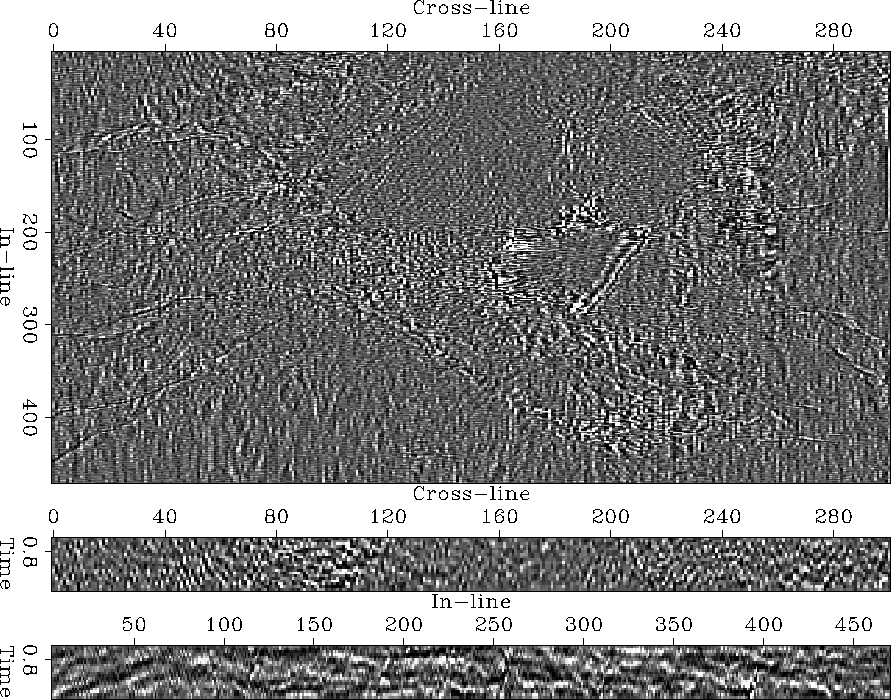
In the case of the Gulf salt dome image
(Figure 29),
the back-projecting crossproduct operator
removes the image's sedimentary layers successfully,
but the delineated faults are slightly corrupted by
the image's considerable noise.
Some of the noise forms short north-south streaks -
best visible in the triangular area in the south-west corner -
and might be due to the image's acquisition footprint.
The border of the central low-amplitude region
is outlined by a broad and fuzzy
zone of higher average discontinuity amplitudes.
The salt region shows some internal features, such as the
linear north-south streaks in its center. The salt's pentagonoid
region is visible but its western border is strangely distorted.
The salt image's vertical north-south section shows a disappointing
amount of remaining sedimentary layers.
In contrast, the east-west section
shows only a few weak hints of the former layering.
Naturally, the near-vertical faults are more visible among the
coherent layers of the north-south section than the rather
incoherent east-west section.
gulfFoltTotDXGAA
Figure 29
Back projection of cross-product residual of the salt image.
The discontinuity map
successfully suppresses the layers in the time slice and delineates
the radiating faults.
Overall, the image's noise makes it unattractive for interpretation.


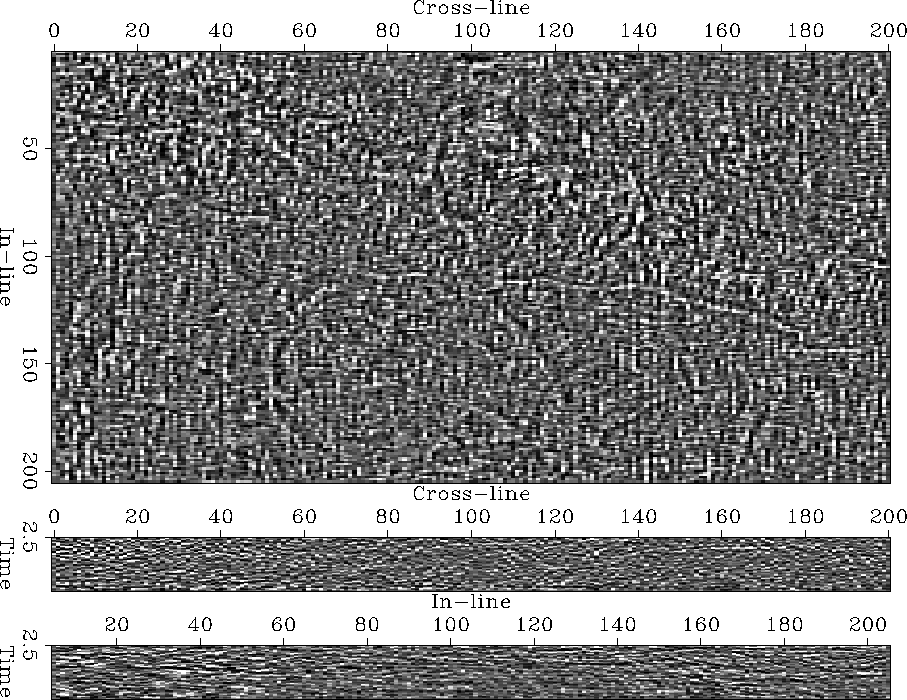
The back-projected crossproduct operator applied to the
North Sea horst image generates an extremely noisy discontinuity map.
A few linear features can be seen at a grazing angle.
The features include the fault marked F
in the original image 12. The sparsity
of features contrasts positively with the complexity of the same
time slice when processed by competing discontinuity operators.
However, the fault surfaces are not isolated in the image noise,
and the vertical sections show considerable layering.
nseaFoltTotDXGAA
Figure 30
Back projection of cross-product residual of the North Sea horst image.
The image is dominated by noise.
At a grazing angle,
the time slice depicts a few gently bending linear features (faults?).


In summary,
the back-projection operator
highlights many interesting details that other discontinuity attributes miss.
However, its overall low signal-to-noise ratio
does prevent interpreters from
quickly and conveniently assessing the geological information.


Next: Plane-wave misfit by correlation
Up: Backprojection of residual
Previous: Backprojection of residual
Stanford Exploration Project
3/8/1999


