


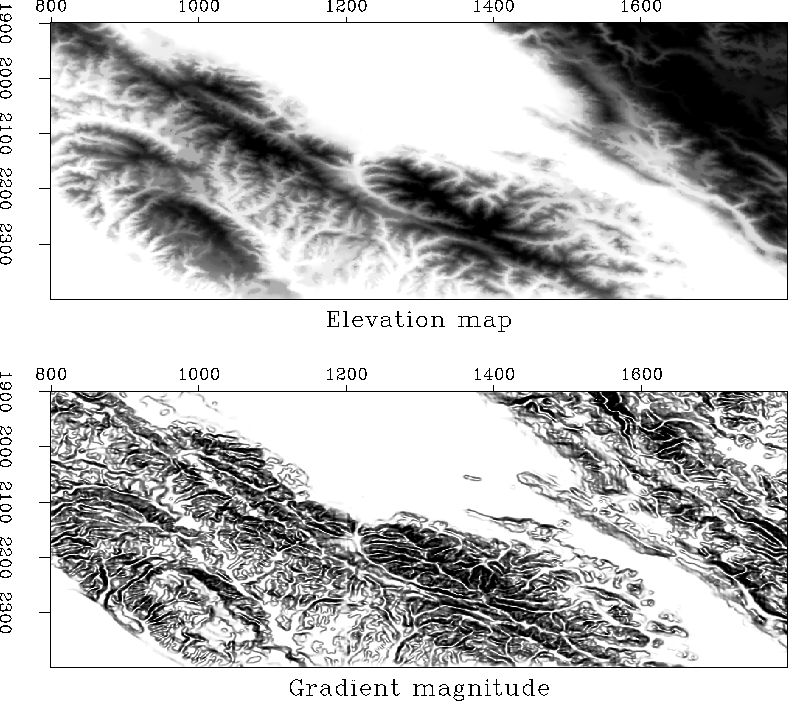
The top panel of Figure 14 shows the Bay Area topography. The gradient magnitude operator distinguishes topographic features by their slope. In contrast to the Bay Area's smooth sloping hills, the magnitude map's multiple areas of zero gradient surprisingly imply a step-like landscape. I assume that the original topography data was probably sloppily interpolated from a contour map. In general, edge detection and discontinuity attributes often reveal such image shortcomings.
 |


However, applied to oscillatory images, such as the synthetic test case in Figure 15, the gradient magnitude operator indiscriminately amplifies the plane-wave layer boundaries as well as the discontinuity between the plane-wave volumes. Consequently, the plane-wave layers are not suppressed and the central fault is not isolated. The amplitude along the enhanced discontinuity surface varies irregularly depending on the amplitude contrast of the adjacent sedimentary layers.
|
zeroFoltGrad
Figure 15 Gradient magnitude operator applied to synthetic test case. The gradient magnitude operator fails to isolate the fault, because it cannot differentiate between the amplitude change across the fault and the amplitude change across the sedimentary layers. | 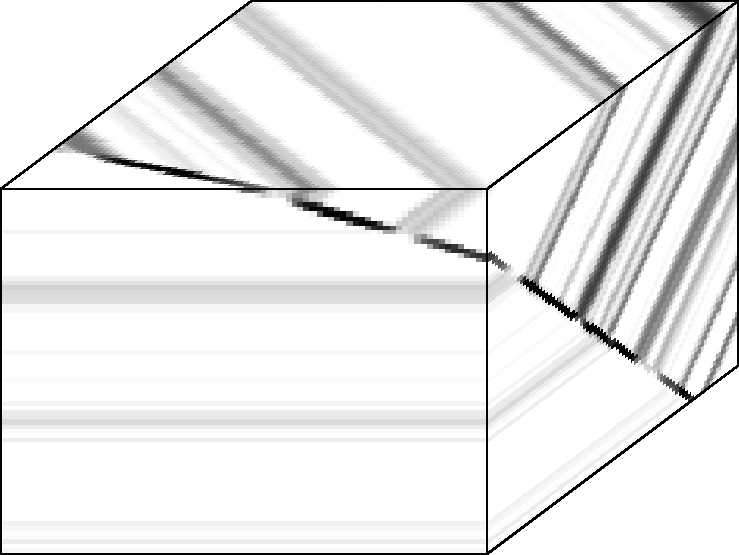 |
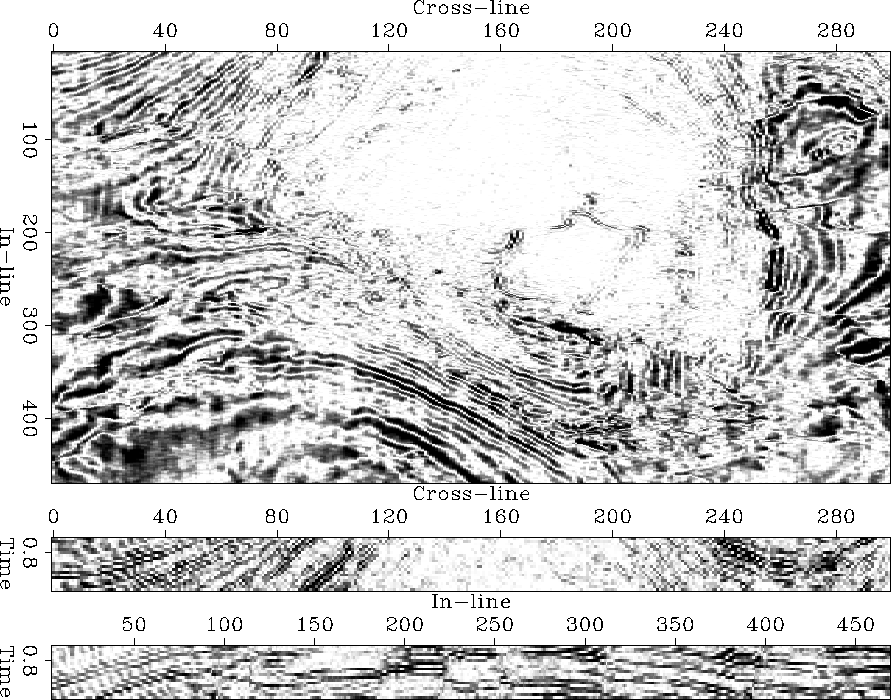
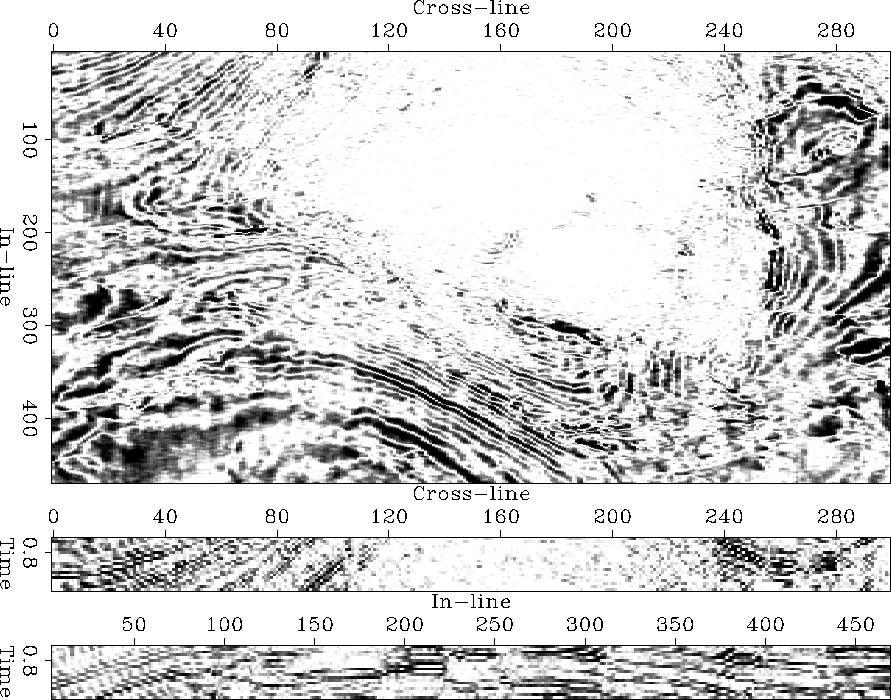
Similarly, the gradient magnitude operator fails to delineate the faults of the seismic image example of Figure 16. The operator increases the overall frequency contents of the image, but does not suppress the sedimentary layer packages. The steeply inclined layers appear aliased in the vertical sections. The faults are hidden among the layer boundaries. Faults, such as the exemplary R fault of the original image 8, can be identified only if one knows where to search for them. The so-identified faults are, however, often only one-pixel wide and, consequently, well resolved. The salt truncating fault is not particularly enhanced. Its position is indirectly indicated by a change in the salt bodies average gradient magnitude. Similarly, the boundaries of the salt dome are not clearly pinpointed.
In the case of the Gulf salt dome and the North Sea horst, the gradient operator fails to isolate the faults and yields a map that is as difficult to interpret as the original seismic image.
 |
 |