


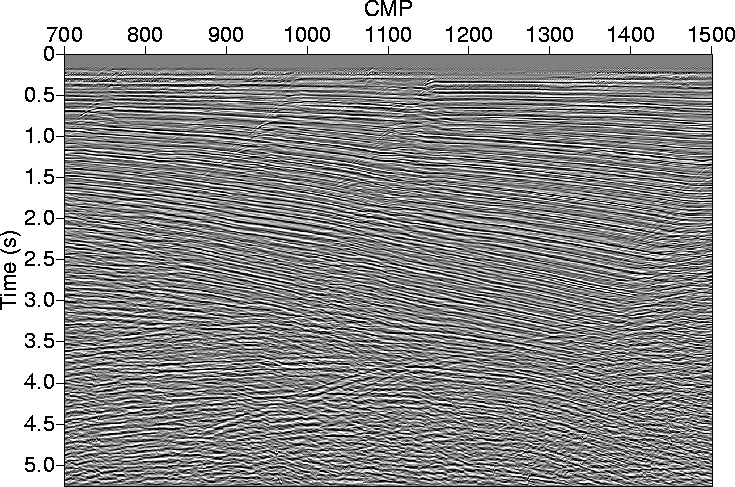
Figure 1 shows a zero-offset section from offshore Trinidad that contains reflections from a large number of dipping faults. Amoco Trinidad Exploration provided the seismic data and the stacking velocities. The section was processed using a conventional 2-D isotropic processing sequence that included a conventional NMO (using the stacking velocities that Amoco provided), followed by a log-stretch (Notfors and Godfrey, 1987) version of Hale's (1984) DMO. Anisotropy is expected to vary with depth due to the alternating sand-dominated and shale-dominated layers. Shales are believed to be the main source of anisotropy in sedimentary basins (Banik, 1984).
 |

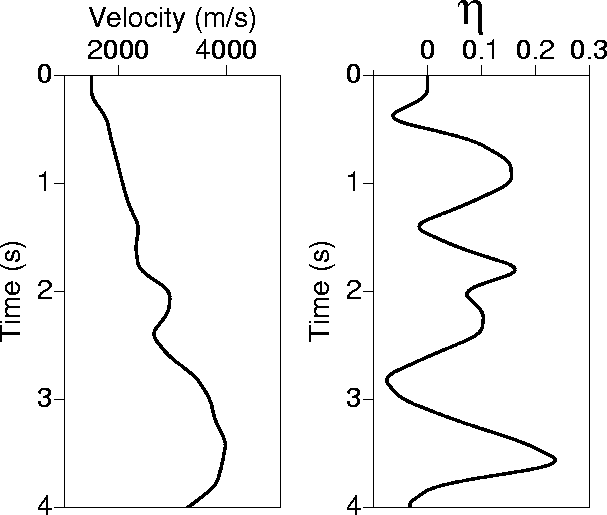 |
Carrying out the inversion process described by Alkhalifah (1997a),
using the measured values
of stacking velocities and corresponding ray parameters, we obtain the
functions
![]() and
and ![]() shown in
Figure 2.
The inversion
assumes no lateral velocity variation in the region of the picks; the
lateral velocity
variation in this region, especially in the first 2 s, is
exceptionally
small
(see Figure 10). In the water
layer,
shown in
Figure 2.
The inversion
assumes no lateral velocity variation in the region of the picks; the
lateral velocity
variation in this region, especially in the first 2 s, is
exceptionally
small
(see Figure 10). In the water
layer, ![]() is 1.5 km/s and
is 1.5 km/s and ![]() is zero. The accuracy
of
these
estimated curves of
is zero. The accuracy
of
these
estimated curves of ![]() and
and ![]() depends on the accuracy
of the stacking-velocity
estimates for both dipping and horizontal reflectors, as discussed by
Alkhalifah and Tsvankin (1995).
depends on the accuracy
of the stacking-velocity
estimates for both dipping and horizontal reflectors, as discussed by
Alkhalifah and Tsvankin (1995).
 |
The smoothed interval values of ![]() in Figure 2 show
variations that might depend on the shale-sand long-wavelength
alterations. Specifically, shales are expected
to induce
anisotropic behavior (Banik, 1984; Sayers, 1994) of waves, while sands
are usually isotropic.
This
in Figure 2 show
variations that might depend on the shale-sand long-wavelength
alterations. Specifically, shales are expected
to induce
anisotropic behavior (Banik, 1984; Sayers, 1994) of waves, while sands
are usually isotropic.
This ![]() curve
best fits the measured stacking velocities, and thus is expected to
improve the image.
The measurement that resulted in
Figure 2 corresponds to the fault under CMP location
1100.
Later we will examine
results from other faults.
curve
best fits the measured stacking velocities, and thus is expected to
improve the image.
The measurement that resulted in
Figure 2 corresponds to the fault under CMP location
1100.
Later we will examine
results from other faults.
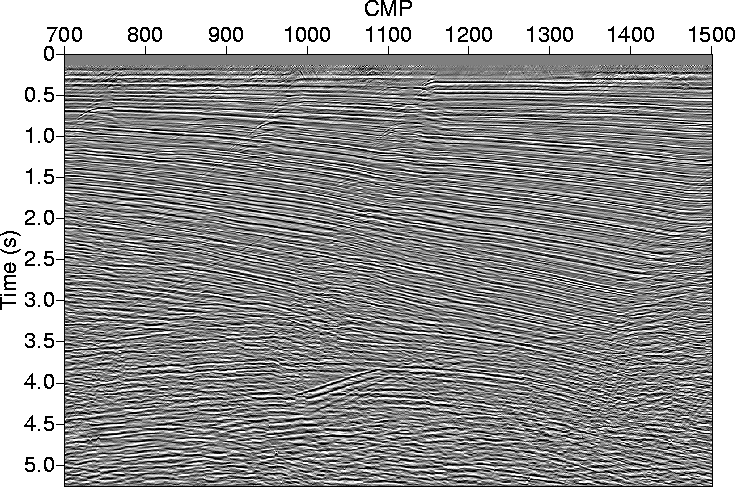
Next, we apply a DMO algorithm that uses the derived functions
![]() and
and ![]() in Figure 2. Figure 3
shows the result
of TI DMO applied to the data, based on the ray-tracing DMO algorithm
described by Alkhalifah (1996).
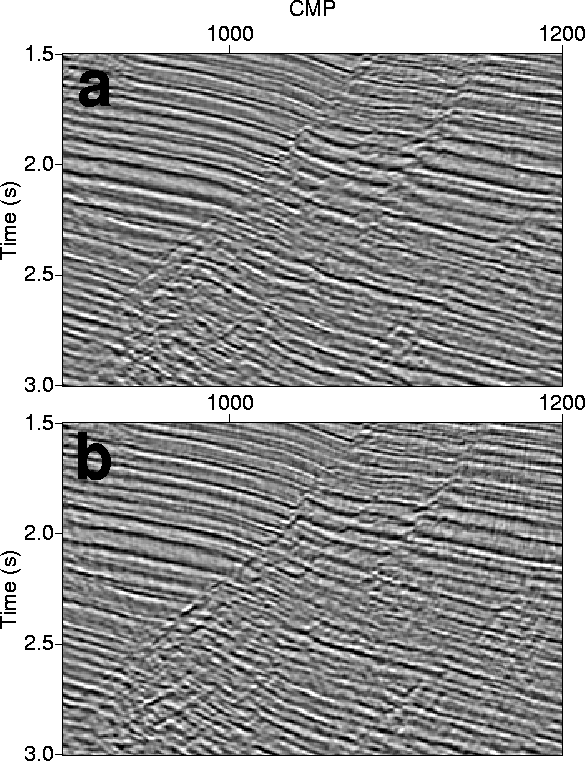
Compared with the results of the isotropic DMO given in
Figure 1, this section should
be improved. A closer look at Figures 1
and 3 (shown in
Figures 4 and 5) shows such
improvements.
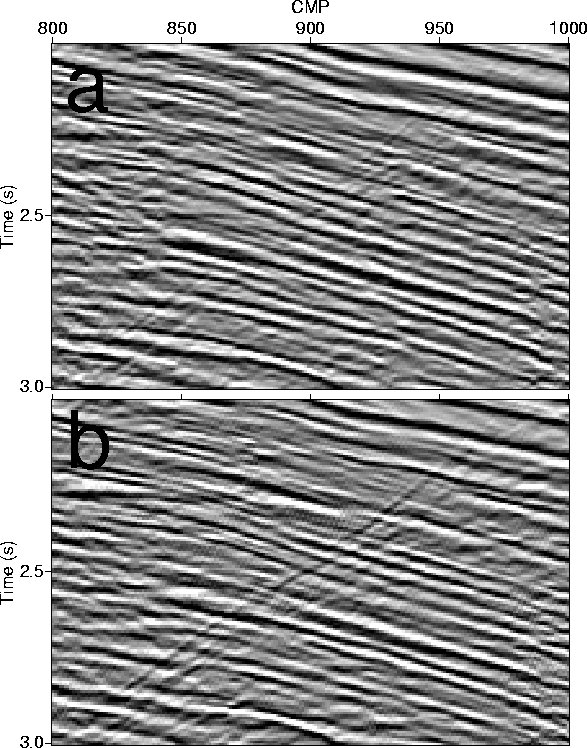
In Figure 4
note the vast improvement in focusing both the dipping fault and the
sub-horizontal reflections
in the anisotropic DMO result (Figure 4b), as opposed
to
the isotropic one
(Figure 4a). Such improvements in focusing are also
observed at later
times (i.e., Figure 5).
in Figure 2. Figure 3
shows the result
of TI DMO applied to the data, based on the ray-tracing DMO algorithm
described by Alkhalifah (1996).
Compared with the results of the isotropic DMO given in
Figure 1, this section should
be improved. A closer look at Figures 1
and 3 (shown in
Figures 4 and 5) shows such
improvements.
In Figure 4
note the vast improvement in focusing both the dipping fault and the
sub-horizontal reflections
in the anisotropic DMO result (Figure 4b), as opposed
to
the isotropic one
(Figure 4a). Such improvements in focusing are also
observed at later
times (i.e., Figure 5).
 |
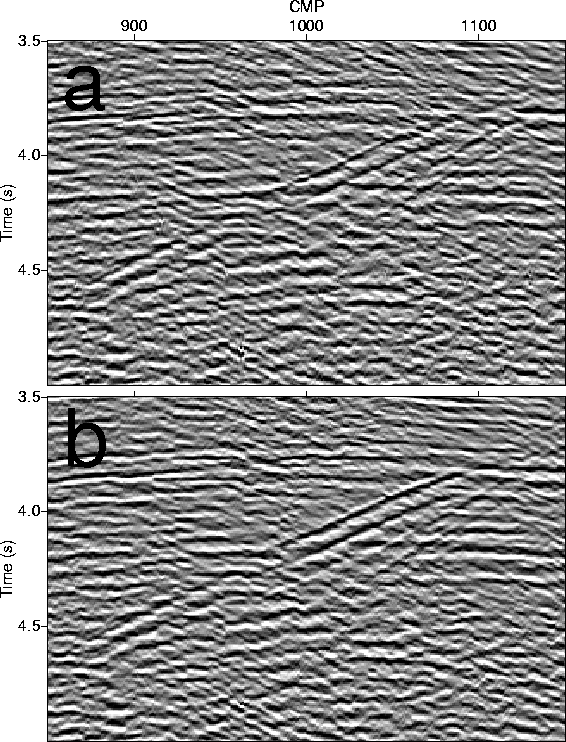 |
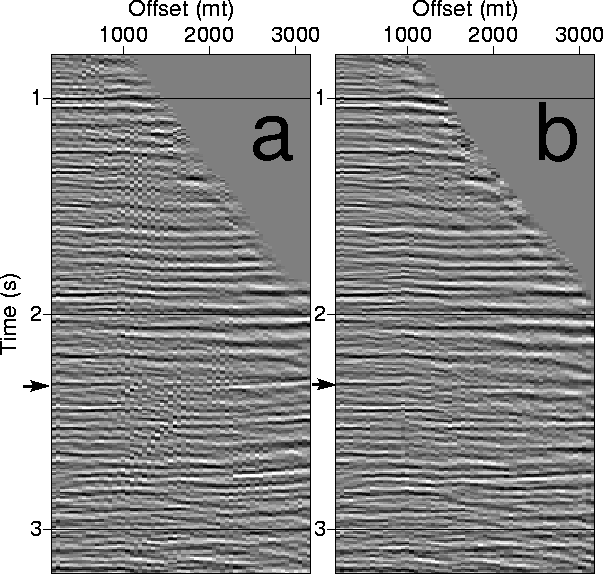
Figure 6 shows CMP gathers from CMP location 936, which contains the imaged fault-plane reflection shown in Figure 4a after (a) homogeneous isotropic DMO, and (b) v(z) VTI DMO. The arrows point to the time of the fault reflection at this CMP location. Whereas the v(z) VTI DMO aligns the fault reflection well, the dipping event after isotropic DMO is misaligned. Improvements are also achieved for sub-horizontal events where DMO managed to correct for the non-hyperbolic moveout that is often largest for small dips.
 |
Although the reflections shown on the seismic line correspond to features within or near the vertical 2-D plane that contains the sources and receivers, some events may represent out-of-plane reflections that require 3-D processing. These out-of-plane reflections, as mentioned earlier, might be expected to stack better at a lower velocity (closer to the isotropic NMO velocity), and therefore focus better in the isotropic image. However, contamination due to out-of-plane events is not expected to be significant for these lines.
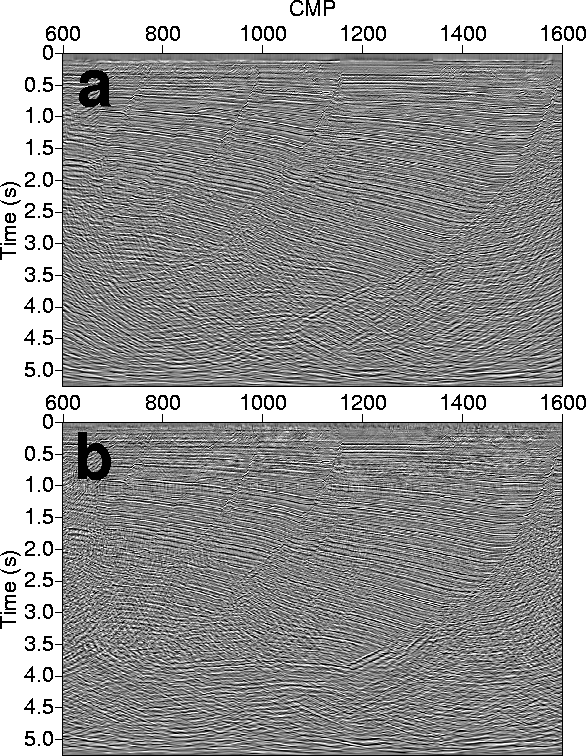 |
Figure 7 show time-migrated sections after (a) isotropic processing, and (b) VTI processing using the inverted parameters shown in Figure 2. Although some improvements in the VTI results can be detected from this figure, a closeup look given by Figure 8 clearly demonstrates the improved imaging achieved by considering anisotropy. Presence of fault plane reflections suggest that the fault is probably a potential reservoir seal. Faults that generate reflections will probably have experienced sufficient movement to cause juxtaposition of different lithologies across the fault plane. These reflections are typically attenuated and/or lost by isotropic processing, while anisotropic processing is successful at preserving these fault plane images.
 |
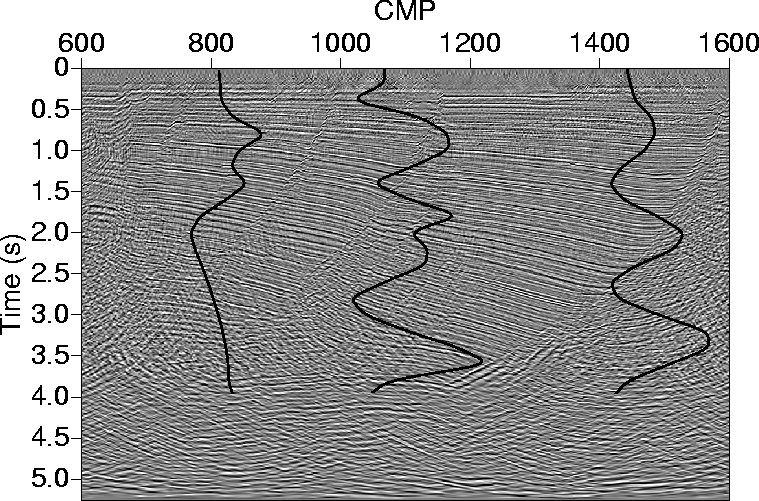 |
Three large faults can be picked from the section in
Figure 3.
Independent estimates for interval ![]() are made at each of these
faults.
Figure 9 shows
the three interval
are made at each of these
faults.
Figure 9 shows
the three interval ![]() curves super imposed on the migrated section
from
Figure 7a. Because
the left most fault shows relatively little throw, the corresponding
curves super imposed on the migrated section
from
Figure 7a. Because
the left most fault shows relatively little throw, the corresponding
![]() curve lacks
the detail evident
in the other two curves, especially at depth. Note, the correlation
among the three interval
curve lacks
the detail evident
in the other two curves, especially at depth. Note, the correlation
among the three interval ![]() curves agrees well with the
continuity of seismic reflections across the section. The lateral
correlation of interval
curves agrees well with the
continuity of seismic reflections across the section. The lateral
correlation of interval ![]() increases confidence that a geologic
parameter is represented by the inversion. Correlation of interval
increases confidence that a geologic
parameter is represented by the inversion. Correlation of interval
![]() estimates across faults could help to remove ambiguity in
determining correlation of seismic picks across a seismic section.
estimates across faults could help to remove ambiguity in
determining correlation of seismic picks across a seismic section.
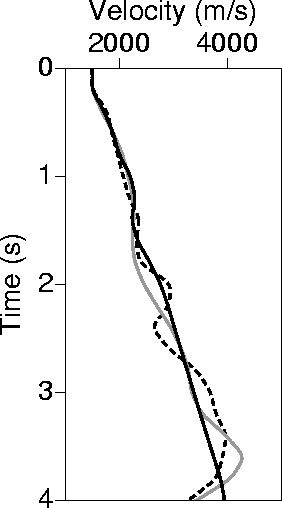 |
To demonstrate the mild lateral velocity variation that exists in this region, Figure 10 shows interval velocities obtained from three separate CMP locations that are more than 2.5 km apart. Velocity changes are insignificant down to 2.0 seconds, and remain very small even at later times.